It’s been a while since my last post as a lot is going on and I had the pleasure to realize some really interesting projects in the past. One of them was to use the Power BI REST API to download Power BI Paginated Reports as PDF locally to a PC. And this is exactly what I will walk you through in this blog post.
Prerequisites
To be able to export reports programmatically, there are some things needed:
- Power BI report (it works the same for Power BI or Paginated Reports)
- Power BI Capacity (either Premium, Embedded, or Fabric)
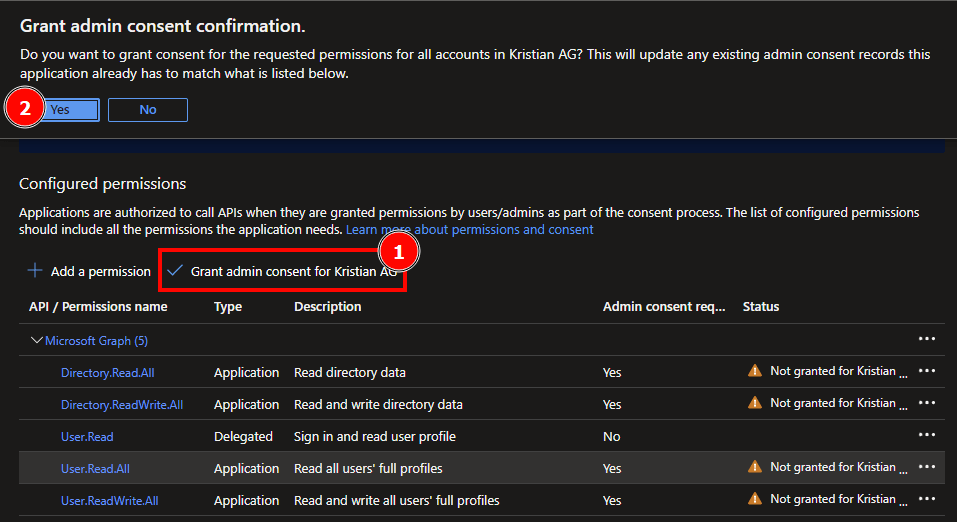
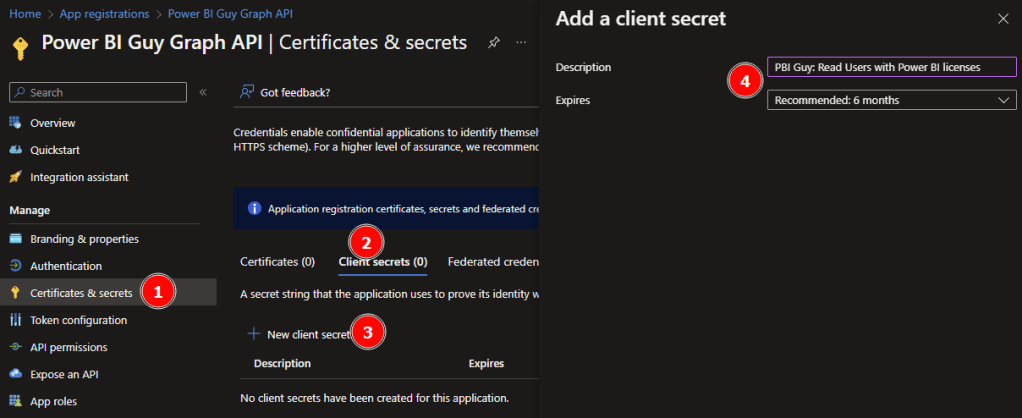
- Service Principal with sufficient permission
- Python skills
- Tool to write / execute Python code (in my case Visual Studio Code)
Setting the scene
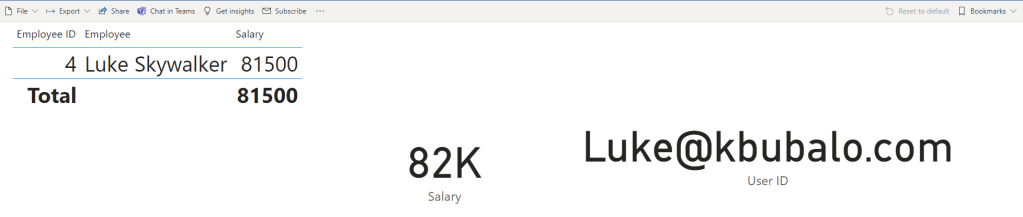
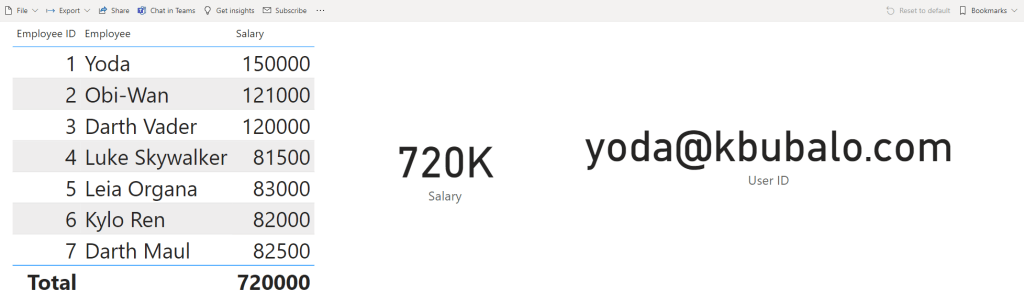
I have a Power BI Workspace assigned to a Power BI Embedded capacity, which has to run during the whole time otherwise I won’t be able to call the Power BI REST API. Further, I have obviously a Power BI Paginated Report to be able to export it to a PDF. In my case, I use the Sales Analysis report which is used as example for the Paginated Report in a Day course. I like this one as it’s simple and uses one Parameter Fiscal Year, which we can also influence during our REST API call.
Let’s code
As usual, the first step working with Python is to import the required libraries. In this case, I’m going to use following ones.
#Import needed libraries
import requests
import json
import pandas as pd
import msal
import os
In my next cell, I specify the required parameters for my Service Principal (if you need to know how to create one, check out this guide here: https://pbi-guy.com/2022/03/10/power-bi-and-activity-logs-with-python/) to be able to authenticate as well as the Workspace, Report ID, and some others. My last parameter will be my local path in which I wish to save the PDF(s).
#Specify Parameters
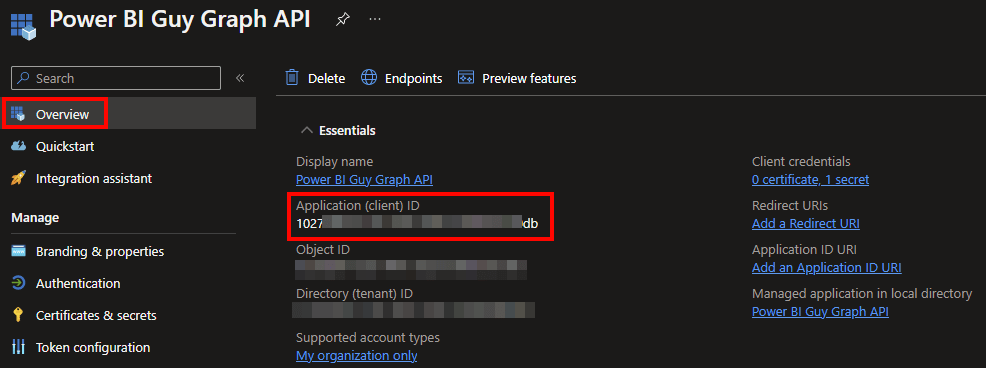
#Service Principal
client_id = ''
client_secret = ''
#Tenant Specification
tenant_id = ''
authority_url = 'https://login.microsoftonline.com/' + tenant_id
scope = ['https://analysis.windows.net/powerbi/api/.default']
#Report Specification
workspace_id = ''
report_id = ''
dataset_id = ''
base_url = 'https://api.powerbi.com/v1.0/myorg/groups/' + workspace_id + '/reports/' + report_id
format = 'PDF'
body = {
"format": format
}
#Report File Specification
path = ''As you probably noticed, there is a Parameter called “format” in which I specify the wished file format (PDF in this case). If you wish to export the reports in another format, you just need to overwrite this specific parameter for example to XLSX or DOCX, depending on your needs.
Now, that we specified all required parameters, we can first authenticate against Power BI Service with our Service Principal. For that, I use following code.
#Use MSAL to grab token
app = msal.ConfidentialClientApplication(client_id, authority=authority_url, client_credential=client_secret)
result = app.acquire_token_for_client(scopes=scope)

if 'access_token' in result:
    access_token = result['access_token']
    header = {'Content-Type':'application/json', 'Authorization':f'Bearer {access_token}'}
Next, we would be able to call the Power BI REST API call to export reports as PDF. Checking the documentation, it highlights that the API is asynchronous. When the API is called, it triggers an export job. After triggering an export job, use GetExportToFileStatus API to track the job status. Read more about the entire flow: Export Power BI reports and Export Paginated reports
This means we need to first call the Export API to trigger an export job. Afterwards, we need to check the status of the export by calling the /exports/{id} API and if succeeded, then we can get and save the file finally.

As I have to make a post resp. get request multiple times, I create in my next cell a function to easy up my life to not write the almost same code over and over again.
#Define Request Functions

#Post Reuqest
def post_request(url, header, body):
    api_call = requests.post(url=url, headers=header, json=body)
    return api_call

#Get Request
def get_request(url, header):
    api_call = requests.get(url=url, headers=header)
    return api_call
Because in my case I have a Paginated Report with Parameters, I’d like to dynamically get all values (Fiscal Year) and create for each year one PDF. If a new year will be added in future, the script should automatically detect that and create a PDF on top of it. For that purpose, I call the Execute Queries REST API to execute a DAX statement to get all Fiscal Year values out of my underlying dataset. Because I created a function in my previous cell, I can just call the post_request function and pass the required parameters to it. Lastly, I have to extract, format, and convert the Fiscal Year values into a Pandas Dataframe. To be sure I got all the values, I print them.
#Execute DAX Statement to get full list for Report Parameter
url_execute_query = "https://api.powerbi.com/v1.0/myorg/groups/" + workspace_id + "/datasets/" + dataset_id + "/executeQueries"
dax = "EVALUATE VALUES('Date'[Fiscal Year])"
query = '{"queries": [{"query": "' + dax + '"}], "serializerSettings": {"includeNulls": "true"}}'
body = json.loads(query)
api_call = post_request(url_execute_query, header, body)

#Transform to Pandas Dataframe
result = api_call.content.decode('utf-8-sig')
result = result.replace('"results":[{', '')
result = result[:len(result)-2]
result = result.replace('"tables":[{', '')
result = result[:len(result)-2]
result = result.replace('"rows":[{', '')
result = result[:len(result)-1]
result = '[' + result
result = json.loads(result)
df_result = pd.DataFrame(result)
df_result = df_result.rename(columns={'Date[Fiscal Year]': 'Fiscal Year'})

print(df_result)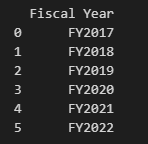
As we can see, I have six Fiscal Year values from 2017 – 2022.
As a next step, we need to call now the /ExportTo API for each Fiscal Year. Thus, I create a for each loop based on the Fiscal Year Dataframe (df_result). As we have to provide a body context in which we can specify the format as well as influence the parameters, I do specifically that. As a response to the call, we get a Export ID which we need later on to be able to export and save the report as PDF. Therefore, I store all of them in one Dataframe called df_export and print it out to make sure I get it for each Fiscal Year.
#Export Report for each value in Report Parameter
export_url = base_url + '/ExportTo'
export_id_list = []
parameter_value_list = []

for index, row in df_result.iterrows():
    current_value = df_result['Fiscal Year'][index]
    body = {
        "format": format,
        "paginatedReportConfiguration": {
            "parameterValues":[
                    {"name": "DateFiscalYear", "value": current_value}
                ]
        }
    }

    api_call = post_request(export_url, header, body)
    export_id = api_call.json()['id']
    export_id_list.append(export_id)
    parameter_value_list.append(current_value)

df_export = pd.DataFrame(list(zip(export_id_list, parameter_value_list)), columns=['Export ID', 'Parameter Value'])
print(df_export)
After we initiated the export for each Fiscal Year, we have to check the status. For that, I created again a for each loop based on the df_export Dataframe this time and check for each Export ID if the status is “Succeeded”. Until then, I print out the current Fiscal Year as well as the current status to have an overview of the current state.
#Get Export Status

for index, row in df_export.iterrows():
    current_export_id = df_export['Export ID'][index]
    current_parameter_value = df_export['Parameter Value'][index]

    url_status = base_url + '/exports/' + current_export_id
    status = ''
    while status != 'Succeeded':
        api_call = get_request(url_status, header)
        status = api_call.json()['status']
        print(status)
        print(current_parameter_value)
Once done, we can finally save our PDF as wished. As I save it in my case on my local machine, I use the os library but obviously you can save the PDF wherever you wish, for example in OneLake, ADLS Gen2, SharePoint, etc. To be able to do that, I once more created a for each loop on the df_export Dataframe and call the /exports/{id}/file API where {id} represents the Export ID from our previous step. Once I got the content, I save it to my local machine. By the way, I influence the file name by providing the current Fiscal Year value (see parameter file_name).
#Save report as PDF
for index, row in df_export.iterrows():
current_export_id = df_export['Export ID'][index]
file_name = df_export['Parameter Value'][index]
url_save = base_url + '/exports/' + current_export_id + '/file'
api_call = get_request(url_save, header)
completename = os.path.join(path, file_name + '.' + format)
with open(completename, 'wb') as f:
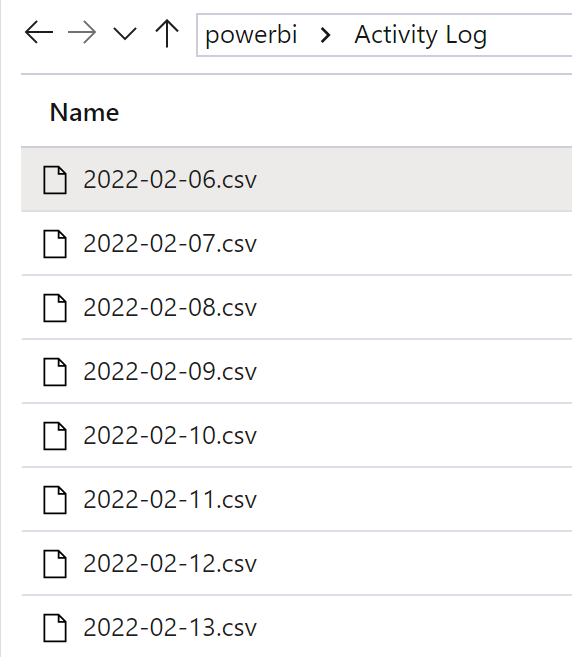
f.write(api_call.content)As a final result, we get for each Fiscal Year one PDF saved to our local machine!

The whole code looks as now as following.
#Import needed libraries
import requests
import json
import pandas as pd
import msal
import os

#Specify Parameters

#Service Principal
client_id = ''
client_secret = ''

#Tenant Specification
tenant_id = ''
authority_url = 'https://login.microsoftonline.com/' + tenant_id
scope = ['https://analysis.windows.net/powerbi/api/.default']

#Report Specification
workspace_id = ''
report_id = ''
dataset_id = ''
base_url = 'https://api.powerbi.com/v1.0/myorg/groups/' + workspace_id + '/reports/' + report_id
format = 'PDF'
body = {

    "format": format
}

#Report File Specification
path = ''

#Use MSAL to grab token
app = msal.ConfidentialClientApplication(client_id, authority=authority_url, client_credential=client_secret)
result = app.acquire_token_for_client(scopes=scope)

if 'access_token' in result:
    access_token = result['access_token']
    header = {'Content-Type':'application/json', 'Authorization':f'Bearer {access_token}'}

#Export Report for each value in Report Parameter
export_url = base_url + '/ExportTo'
export_id_list = []
parameter_value_list = []

for index, row in df_result.iterrows():
    current_value = df_result['Fiscal Year'][index]
    body = {
        "format":"PDF",
        "paginatedReportConfiguration": {
            "parameterValues":[
                    {"name": "DateFiscalYear", "value": current_value}
                ]
        }
    }

    api_call = post_request(export_url, header, body)
    export_id = api_call.json()['id']
    export_id_list.append(export_id)
    parameter_value_list.append(current_value)

df_export = pd.DataFrame(list(zip(export_id_list, parameter_value_list)), columns=['Export ID', 'Parameter Value'])
print(df_export)

#Get Export Status

for index, row in df_export.iterrows():
    current_export_id = df_export['Export ID'][index]
    current_parameter_value = df_export['Parameter Value'][index]

    url_status = base_url + '/exports/' + current_export_id
    status = ''
    while status != 'Succeeded':
        api_call = get_request(url_status, header)
        status = api_call.json()['status']
        print(status)
        print(current_parameter_value)

#Save report as PDF

for index, row in df_export.iterrows():
    current_export_id = df_export['Export ID'][index]
    file_name = df_export['Parameter Value'][index]

    url_save = base_url + '/exports/' + current_export_id + '/file'
    api_call = get_request(url_save, header)

    completename = os.path.join(path, file_name + '.' + format)

    with open(completename, 'wb') as f:
        f.write(api_call.content)
Please let me know if this post was helpful and give me some feedback. Also feel free to contact me if you have any questions.
If you’re interested in the files used in this blog check out my GitHub repo https://github.com/PBI-Guy/blog