A lot of customers are asking me what are the differences between Power BI and Paginated Reports, why should they use one OR the other. My answer is mostly: It’s not one OR the other, why not combine and get the most out of both worlds?! I suggest in many cases that Power BI can be used as interactive dashboard “entry-tool” for end users to analyze dynamically their data. But once a pixel-perfect report should be created as PDF (it’s mostly PDF so we’re going to focus on this format) Paginated Reports are simply better. So why not creating a button within your Power BI report to take all the selected filters automatically and create out-of-the-box a Paginated Report PDF print-out? Most customers are first wondering that this kind of scenarios are possible and of course wondering how it can be done. Let me walk you through how to add such a button within a Power BI report in this blog post.
Prerequisites
- Power BI Report
- Paginated Report
- Power BI Desktop
- Power BI Report Builder (recommended)
- Power BI Premium / Power BI Premium per User / Power BI Embedded
- Basic understanding of both worlds
I already have a Power BI and a Paginated Report ready to combine it. If you’re not familiar how to create a Paginated Report or from where to get a simple demo file I can highly recommend the Power BI Paginated Reports in a Day Course. In this course you’ll learn the differences between Power BI and Paginated Reports, how to start and build your first report, and how to publish it afterwards to Power BI.
Further Paginated Reports are only supported with Premium. Therefore you will need a Power BI Premium capacity, Premium per Use license, or Power BI Embedded.
How to
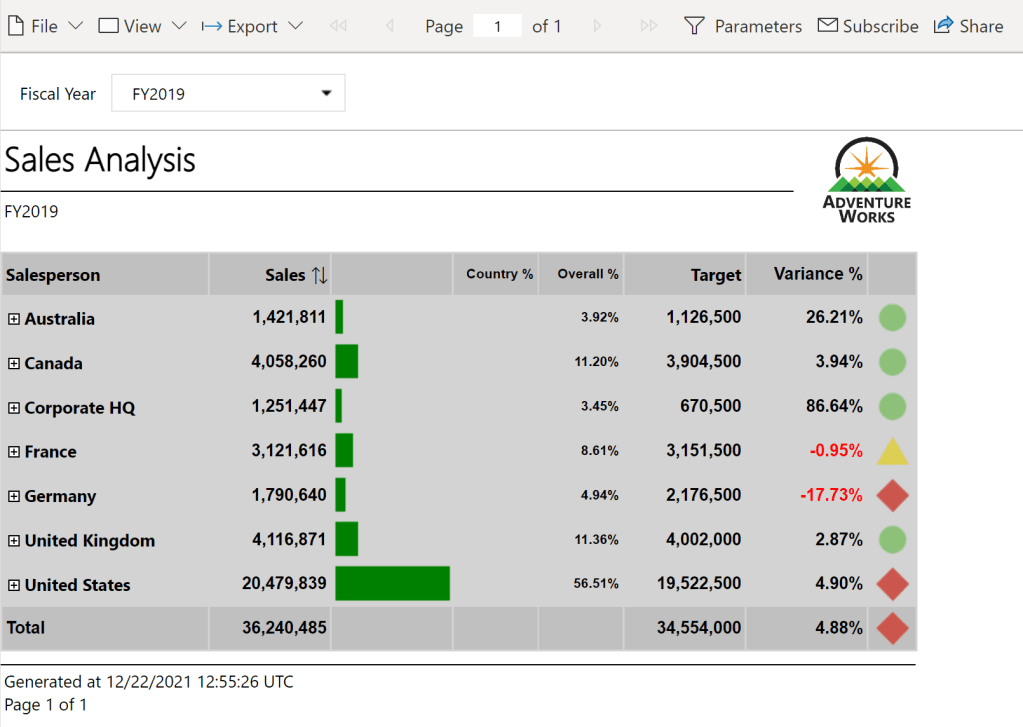
The very first thing we need to do is to publish our Paginated Report to Power BI to get the unique ID of the report from the Service. In my case I open the RDL file with Power BI Report Builder and publish it to a workspace backed up with a PPU license. I name it Sales Analysis.

Once done the report will be available in Power BI Service. If we open it we’ll see the URL pointing to our specific workspace with a unique ID (1a8b6910-c4a2-4611-ae75-5d0b968eb6d3) and pointing to our Sales Analysis Paginated Report which has as well a unique ID (66a1a70a-89cf-4d48-80c1-39d766f9892b). This means we can use this URL to get to our just published Paginated Report.

If we check the Microsoft Documentation about Power BI and how the URL is build (see https://docs.microsoft.com/en-us/power-bi/paginated-reports/report-builder-url-parameters) we see that the URL can be enhanced to provide values for parameters, to provide commands to get a specific format, and many more. So before building something in our Power BI report let’s try the URL to understand what’s possible.
Let’s first try to give a value to the parameter. To initialize a parameter we have to add “?rp:parametername=value”. In our case the internal parameter name of the Paginated Report is called DateFiscalYear and can be checked in Power BI Report Builder. Checking the properties we also see that the parameter is a data type text.

If we’re looking for possible values we can check the “Available Values” and see if a query is used or something is hardcoded within the parameter settings. Alternatively we can also open the Report in Power BI Service and check the drop down list of the Parameter. If we do so we can see that following values are expected.

Let’s try to build the URL now with what we got so far:
| URL to Report | https://msit.powerbi.com/groups/1a8b6910-c4a2-4611-ae75-5d0b968eb6d3/rdlreports/66a1a70a-89cf-4d48-80c1-39d766f9892b |
| Initializing Parameter | ?rp: |
| Parameter Name | DateFiscalYear |
| Parameter Value | FY2019 |
| Whole URL | https://msit.powerbi.com/groups/1a8b6910-c4a2-4611-ae75-5d0b968eb6d3/rdlreports/66a1a70a-89cf-4d48-80c1-39d766f9892b?rp:DateFiscalYear=FY2019 |
If we call the URL now the parameter is automatically set to FY2019 and the report is loaded.
Let’s go further and try to get a PDF automatically. To do so we only need to add “&rdl:format=PDF” at the end of our URL. The “&” symbol combines different commands and to get a PDF automatically the rdl:format=PDF is necessary. Therefore our whole URL looks now as following:
If we call this URL Power BI will automatically generate a PDF.

So far so good! Now that we understand how the URL of a Paginated Report works and how we can modify it let’s try to implement it in our Power BI Report.
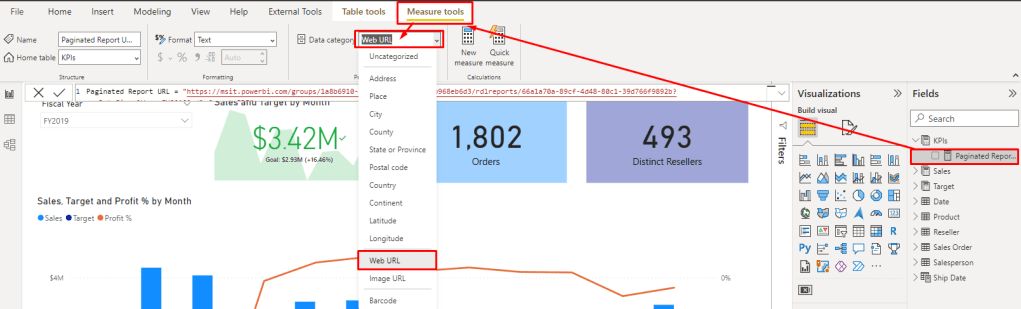
After opening the Power BI Report in Power BI Desktop we can add a simply DAX measure with our hardcoded URL to call the Paginated Report.
Paginated Report URL = “https://msit.powerbi.com/groups/1a8b6910-c4a2-4611-ae75-5d0b968eb6d3/rdlreports/66a1a70a-89cf-4d48-80c1-39d766f9892b?rp:DateFiscalYear=FY2019&rdl:format=PDF”

Once added make sure to mark it as Data Category Web URL.
If we add now the measure to our report we see our hardcoded URL. If we click on it the Paginated Report will open. Unfortunately it’s not “connected” with our Power BI Report so far. Meaning if I change the Slicer for example to FY2020 the URL will still point to FY2019. Let’s fix this with some DAX magic.
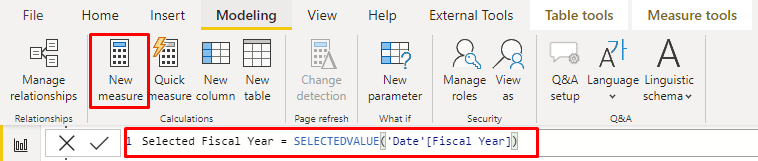
I add a new Measure to get the selected value of the slicer. In this case I use following formula:
Selected Fiscal Year = SELECTEDVALUE(‘Date'[Fiscal Year])
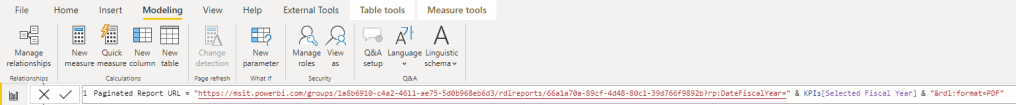
Now I just replace the hardcoded FY2019 from the first Measure with my second Measure. The DAX Measure looks now as following:
Paginated Report URL = “https://msit.powerbi.com/groups/1a8b6910-c4a2-4611-ae75-5d0b968eb6d3/rdlreports/66a1a70a-89cf-4d48-80c1-39d766f9892b?rp:DateFiscalYear=” & KPIs[Selected Fiscal Year] & “&rdl:format=PDF”
Now every time I select another FY my URL will automatically adopt. That’s very simple with a single selection but what if I wish to have a multi selection, will it still work? Let’s try it out. But before testing the URL we need to make sure the Slicer is enabled for Multi Selection as well as the Parameter in our Paginated Report. Therefore I change the settings of both.

Don’t forget to republish the Paginated Report once the Property has been modified.
Let’s test our URL now in Power BI if we select two FY. I added the Paginated Report URL Measure into a Table visual to see it and select two different FY. Unfortunately the URL do not show both years, even worse it just disappeared. The reason behind is that the SELECTEDVALUE function expects one value.

Luckily we can also give an alternative to the SELECTEDVALUE function in which we can concatenate multiple values. To make sure we got the each value just once we need to use the DISTINCT function as well. Our Selected Fiscal Year Measure looks now as following.
Selected Fiscal Year = SELECTEDVALUE(‘Date'[Fiscal Year], CONCATENATEX(DISTINCT(‘Date'[Fiscal Year]), ‘Date'[Fiscal Year]))

Unfortunately it combines now FY2019 and FY2020 into one string and the URL contains now FY2019FY2020 which will not work. Even if we separate the two fiscal years with a comma or something else it will still not work as Paginated Report will recognize it as one value (e.g. “FY2019, FY2020” is one value and the report will not load). Therefore we need to add for each value the parameter again like in the Documentation described (see https://docs.microsoft.com/en-us/power-bi/paginated-reports/report-builder-url-parameters#url-access-syntax). The syntax looks as following:
powerbiserviceurl?rp:parametername=value&rp:parametername=value
In our case this means we have to have rp:DateFiscalYear=FY2019&rp:DateFiscalYear=FY2020 after the question mark. Let’s adjust our Selected Fiscal Year Measure to get the right URL needed. If we closely look to the syntax we see that the Delimiter can be specified. We’re going to use this and add “&rp:DateFiscalYear=”. In this case every time two ore more values are selected the values will be separated with the right expression. Our final DAX measure looks now as following:
Selected Fiscal Year = SELECTEDVALUE(‘Date'[Fiscal Year], CONCATENATEX(DISTINCT(‘Date'[Fiscal Year]), ‘Date'[Fiscal Year], “&rp:DateFiscalYear=”))

We can also see that the URL is changing dynamically based on the FY selection. If we click now on the URL the Paginated Report will open with the two FY selected and print out a PDF automatically.

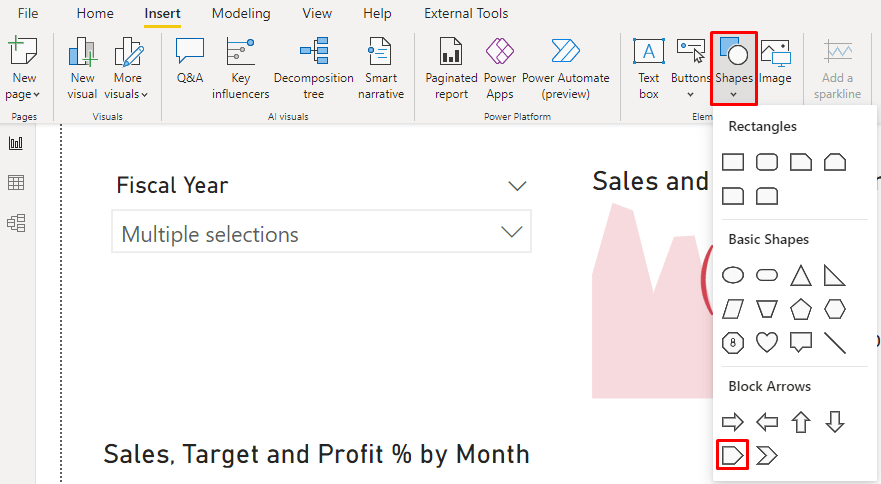
Our last step is now to create a button in our Power BI Report and publish it afterwards.
In my case I choose the Pentagon Row shape and add it into my report. Of course you can modify it as wished or even use a visual instead of a shape / button to achieve the same result (open the paginated report).
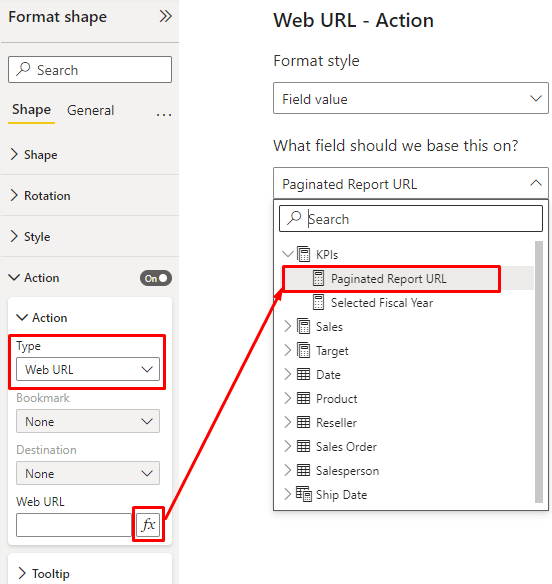
Position the shape and configure it as needed. Lastly modify the Action property, set the Type to Web URL and configure our DAX Measure to be used as Web URL.
Now just publish the Power BI Report and use the button to open the Paginated Report based on your Slicer selection in Power BI.
Conclusion
As we see we can use Power BI as entry point and use it to set filters to open a Paginated Report afterwards. Due to the flexibility of the Paginated Report URL we can also specify in which format the report should be exported. This could also be a dynamic selection in Power BI. There are further integration possibilities thanks to the Paginated Report Visual in Power BI to display a Paginated Report directly in Power BI.
Please let me know if this post was helpful and give me some feedback. Also feel free to contact me if you have any questions.
If you’re interested in the files used in this blog check out my GitHub repo https://github.com/PBI-Guy/blog