Creating Power BI reports in Switzerland can be challenging when it comes to the question: In which language should we display the report? The reason behind is that Switzerland has 4 official languages and if we consider English, it’s even 5. Therefore it’s not easy to fulfill this requirement with one report – or is it? Let me walk you through different scenarios how you can create multilingual reports with Power BI.
Possible Solutions
As in most scenarios in Power BI there are different ways to achieve the same goal. Therefore let me list some solutions:
- Create a separate report for each language
- Create one report and translate data through a service (like Azure Cognitive Services)
- Create a Datasets for each language
- Create a report, use a “translation table”, and work with bookmarks
- Create one report and a “translation table” to display the right language
Of course each scenario has his pros and cons so let me go through some of them quickly and focus afterwards on the main solutions I’m going to present in this post.
Create a separate report for each language
Creating a separate report for each language is from my point of view a maintenance nightmare. Imagine having 5 different languages, therefore having 5 “different” reports (which all look the same but using only a different language), and now you have to customize a visual. Not only you have to do the work multiple times, you have to do it every time a modification is required! Besides that you have to keep an overview which users has access to which report making sure they have access to the right language. Therefore I wouldn’t recommend to go this path and look into other ways to fulfill the multilingual report requirement.
Create one report and translate data through a service
Using a Service to translate your data is a nice and handy solution. The good side of this approach is that you do not have to create your own translation for each word and sentence for each language. This can be done automatically through an API. On the other hand the translation itself could lead to unexpected results, sentences could be translated in a wrong or misleading way which can cause other, unexpected issues which could be avoided in the first place. Therefore it’s not a perfect solution but for sure one worth trying if you do not have a “translation table” which can be used. If you’re interested in how to call an API to translate your data let me know and I’ll be happy to post about it in future.
Create a Datasets for each language
Chris Webb wrote a great article (see https://blog.crossjoin.co.uk/2021/02/21/implementing-data-as-well-as-metadata-translations-in-power-bi) how you can create multiple Datasets – one for each language – and use the DirectQuery Mode (not Live Connection! 😉 ) to connect to the needed Dataset. This approach has also his benefits as the data and meta data like column name and title can be translated. On the other hand it’s again a maintenance effort for all the different Datasets and PBIX files.
Create a report, use a “translation table”, and work with bookmarks
I saw a post from Greg Philips how you can handle Multilingual Reports with a translation table and multiple pages and bookmarks. Everything is described here: https://blog.enterprisedna.co/create-a-multilingual-power-bi-report/
This solution gives you the full flexibility to translate data, columns, titles, etc. in your report. On the other hand you would need to create a separate page for each language and maintain the bookmarks on top of it. If changes will occur you would need to change it on every page. Still better than having multiple reports, but could lead to a lot of maintenance hours. Nevertheless it’s a really nice solution to work with different languages in one report.
Create one report and a “translation table” to display the right language
Another approach is to have a “translation table” within Power BI which is used to translate the needed data in the right language. Let me walk you through how this could look like in Power BI.
As an example imagine we have a table with some fruits, numbers, and an ID for each fruit. Further we have a second table with the fruit ID, display language, and the translated value.

Once in Power BI imported you can create a relationship between the two tables through the ID if that’s not already automatically done during the import process.

As a next step you can add a Slicer Visual using the Language column from the Language table and add a Table Visual with the Number Column from the Fruits table and Value Column from the Language table.
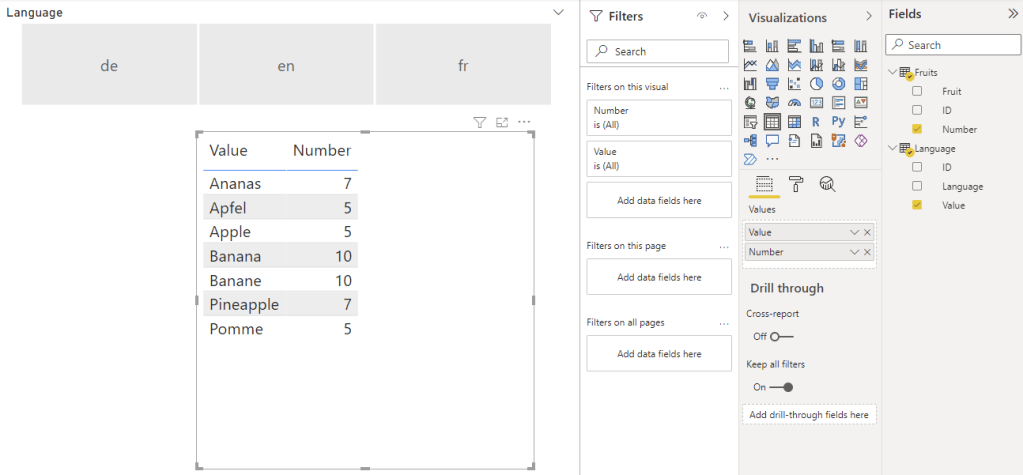
If you select now a language in the slicer the Table Visual will filter it to the selected language. You can even force a selection through the slicer in the settings by turning on “Single select”.

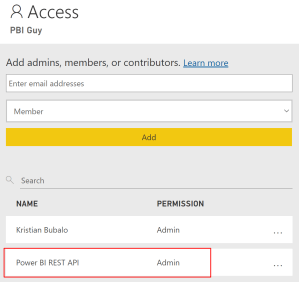
To enhance this solution and apply automatically the correct language you can even build a third table matching the language with an user and use RLS to apply the right language. In my simple solution I created following table.
Tip: I blogged about RLS a while ago and if you’re interested in how to implement it check it out here: https://pbi-guy.com/tag/row-level-security/

As you can see the table contains the language, name and UPN of each user. Once in Power BI imported create a relationship between the language column from the User Language table and the Language column from the Language table. Our whole relationship model looks now as following.

Our next step is to create a role and set a rule so users can only see their specific language. We’re going to user the USERPRINCIPALNAME() to identify which user is logged in and match the mail address with the User Language table.

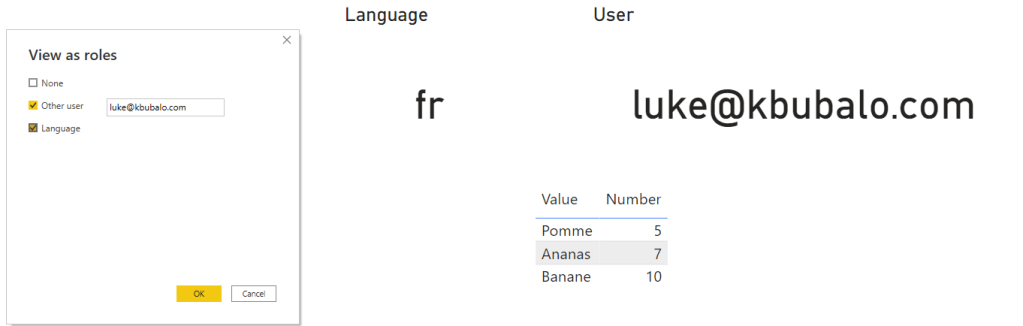
Once this is set up the Slicer Visual is not needed anymore as through RLS the data is already filtered. I just added a card visual showing the current language and the USERPRINCIPALNAME (I created a DAX measure for this). If we test now RLS on behalf of another user – let’s take Luke – we see following.
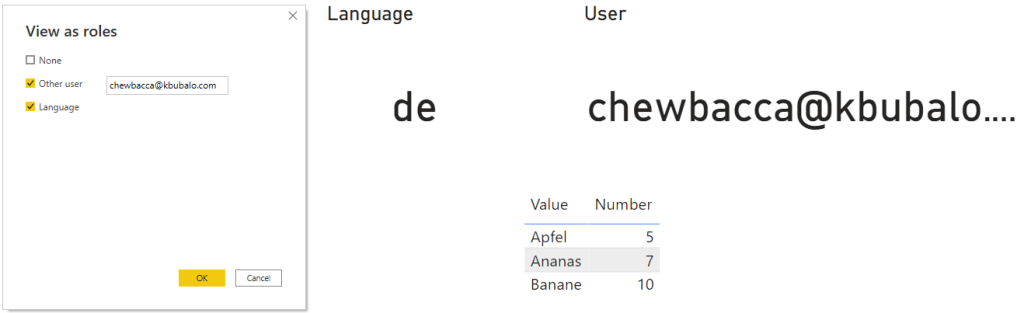
If we change it to Chewbacca the language will apply automatically.
This approach is very good if you do not have a lot of data and languages. As you can imagine if you add a new fruit your language table will need three more lines for the three languages in this case. If you add a new language your language table will increase even more which leads to a bigger data model size in both cases. Further performance can decrease due to the implemented RLS rule. On the other side user experience can increase as the language will automatically apply but users can’t change it on their own if RLS is in place (e.g. in my personal case I prefer to display everything in English even if I’m based in the German-speaking part of Switzerland).
Besides data translation Power BI offers ways to translate field and table names automatically as well. Let me show you how to add different languages into your model.
Translate Power BI field and table names
To be able to add multiple languages into your model you’ll need to work with third-party tools. This could be Visual Studio, Tabular Editor, or anything else that can handle and configure a tabular model. In my case I like to work with Tabular Editor because as soon as you install it you’ll have it integrated in Power BI Desktop to open it directly from the ribbon connected to your model.

Once opened you’ll find a “Translations” folder in your model. Right-click on it and hit New Translation.

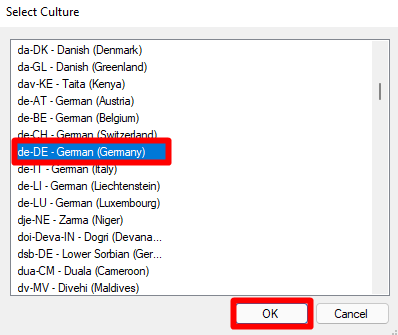
A new window will pop-up where you can choose which culture you wish to add. In my case I select de-DE and hit OK. This means once translations are implemented in de-DE language Power BI will recognize the Browser or Power BI Desktop Language Settings and display automatically the translation of my tables and columns in this language.
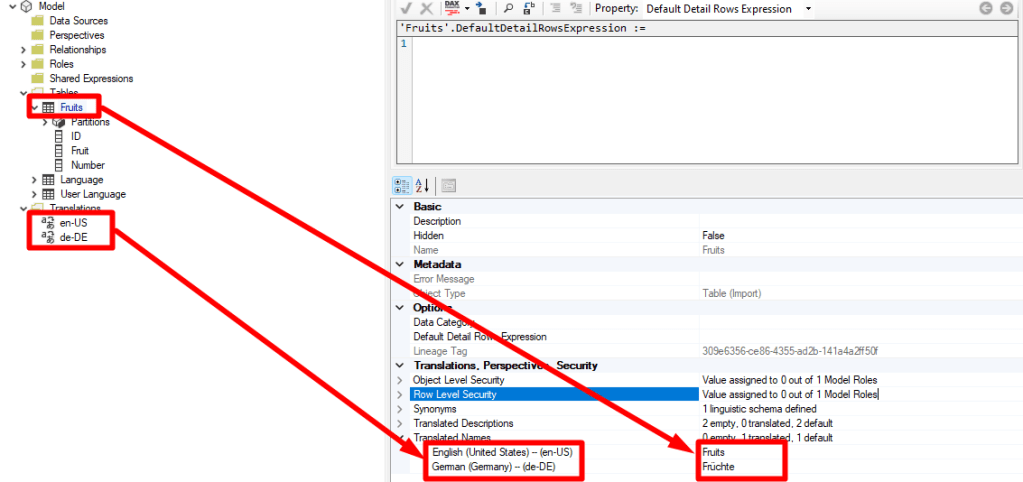
You’ll notice how the Translation folder has now two different languages. In my case en-US and de-DE. Now I can expand the Tables folder, select a table or column, scroll down to Translated Names Properties and add for each language a translation. As you can see in my example below I choose the table Fruits and translated it to Früchte in German.
To make the translation easier Chris Webb has a very useful and easy-to-use tool which is available for free here: https://www.sqlbi.com/tools/ssas-tabular-translator. To be able to use it export the translations as json file and import it afterwards by right-clicking on the Translations folder in your model.
Once everything is translated as wished save your model and publish the report to Power BI Service. In there you have to change the browser language or choose through Power BI settings your preferred language and your table and column names will be display accordingly. If you wish to test in in Power BI Desktop keep in mind that since March 2021 release Power BI Desktop will not reflect the model translations so you would need to have an earlier version if you wish to do so.
Edit: Further keep in mind that this works only with Premium. Therefore you’ll need Power BI Premium, Premium per User, or an Embedded capacity.
Please let me know if this post was helpful and give me some feedback. Also feel free to contact me if you have any questions.
If you’re interested in the files used in this blog check out my GitHub repo https://github.com/PBI-Guy/blog