How to use Incremental Refresh on ANY data source!

A few days ago, a colleague asked me if it would be possible to have more data from the Azure Cost Management API than only the last 30 days. Obviously, my first thought was sure, let’s use Azure Synapse and store it in a Data Lake. But then the real challenging question was asked: Would it be possible purely and only with Power BI, not with other services and tools? I was like: Let me brainstorm with my good colleague and co-organizer of the Power BI User Group Switzerland, Denis Selimovic. After a few minutes we (mainly him, but I’ll never admit it šŸ˜€ ) came up with the idea of using Datamarts as staging area and using Dataflows afterwards to enable Incremental Refresh. With this workaround, we’ll have an Azure SQL DB (this is technically a Datamart behind the scenes) as staging area, and therefore Incremental Refresh will work as Query folding will be possible! Denis already wrote a great article how to set it up for the Power BI Log Files, which only holds the last 30 days. Check it out here: https://whatthefact.bi/power-bi/power-bi-datamart/persisting-temporary-accessible-data-via-power-bi-datamarts-with-the-example-of-power-bi-activity-logs/ In my blog post I’m going to use a SharePoint site to test at the end the different scenarios (deleting, modifying, and adding new data). I just want to highlight one more time: This approach will work with any Data Source that Power Query / Datamart can connect to. So, it will also work with Excel Sheets, CSV files, BLOB, etc. What a game changer!

What is this Incremental Refresh, Query Folding, and why should I care?

Usually, if you connect to a data source with Power BI – and once your transformation and modelling is done – you set up an automatic refresh of the dataset. The beauty of this is, that all data will be refreshed every time. That works perfectly fine for small datasets. But what if you wish to only update the last few days because there is no need to refresh data from last years as those data never changes? For example, a sales report showing my sales from 2012 – 2022. Sales coming from the years 2012 – 2021 do not change usually so there is no need to update them on a regular base therefore we’re looking for a way to update only the last 7 days of 2022 in this example. This will speed up the Dataset refresh and that’s exactly what Incremental Refresh does. As creator of a dataset, you can set up how many days, months, or years you wish to refresh and everything older than that should just be stored. More insights about Incremental Refresh can be found here: https://docs.microsoft.com/en-us/power-bi/connect-data/incremental-refresh-overview

And how does Query Folding plays a role in this whole setup? Because we configure a specific date in our refresh (in our example we wish to refresh only the last 7 days of 2022), this date has to be provided somehow to the data source. If we’re talking in SQL, this means there has to be somewhere a WHERE clause filtering the data to the last 7 days. While Power BI connects to the data source, it tries to create Queries in the data source language (so if we connect to a SQL DB, it will talk SQL) and on top it tries to push all the different transformations that we did in Power Query to the data source. Again, as an example, if we rename a column from “Column A” to “Revenue” and our data source is SQL, it will generate something like SELECT [Column A] as [Revenue] so that SQL does the transformation. This is exactly what Query Folding is. It tries to push the transformations down to the data source. My friend and MVP Nikola Ilic did a great blog about Query Folding which you can find here: https://data-mozart.com/what-is-a-query-folding-in-power-bi-and-why-should-i-care/ or if you’re more interested in the Microsoft Docs following this link: https://docs.microsoft.com/en-us/power-query/query-folding-basics

Due to the fact that Incremental Refresh requires Query Folding to be able to get the latest data we’re looking for, not all data sources are supported. As an example, Excel, BLOB, CSV files, can’t be incrementally refreshed until now!

Power BI Datamarts

During Build 2022 in May, Microsoft announced a new artefact called Power BI Datamarts (see https://powerbi.microsoft.com/en-us/blog/democratize-enterprise-analytics-with-microsoft-power-bi/) to democratize enterprise analytics for everyone. With Datamarts, every user has an intuitive no code / low code database solution at hand as behind the scenes, an Azure SQL Database will be created.

A datamart creator can use the no code experience to extract, transform, and load data into a database that is fully managed by Power BI. There’s no need to worry about creating and managing dataflows or data refresh schedules—it’s all automatic. The user gets an intuitive SQL and visual querying interface for performing ad-hoc analysis on the data. Users can then connect to the datamart using external SQL-aware tools for further analysis.

Arun Ulagaratchagan

Therefore, we can connect to any data source, load it into a Datamart, and store it technically in a Database. Because now we have our data in our database, we can connect to it with a Dataflow and set up Incremental Refresh as Query Folding is now supported!

Let’s create a Datamart

As of today, Power BI Datamart is in Public Preview and a Premium feature so Premium, Premium per User, or Embedded is required. In my case I’m going to use a PPU license to create a Datamart. To be able to do so, I log in to PowerBI.com and select my demo workspace PBI Guy. In there, I choose New and select Datamart.

For the purpose of this blog post, I’m going to use a SharePoint list but as mentioned already, you can easily use something else like an Excel Sheet, CSV file, etc.

Therefore, I have to select Get data from another source and choose SharePoint Online list afterwards. Once selected, I provide my SharePoint site and my credentials, select my list, and hit transform data.

In Power Query Online I select only the needed columns (ID, Title, Date, and Revenue) and make sure that all data types are correct. As Incremental Refresh requires a DateTime column, please ensure your date column is set up correctly.

Once done, I select to load the data into my Datamart, and rename it on the next screen to “Staging Datamart” by selecting the arrow at the top.

Next, I create a Dataflow which should connect to my Datamart. Before I do so, I go back to my workspace, select the three dots besides my newly created Datamart, and hit Settings.

In there, I expand Server settings and copy the string.

Now I head back to my workspace, select New, and choose Dataflow.

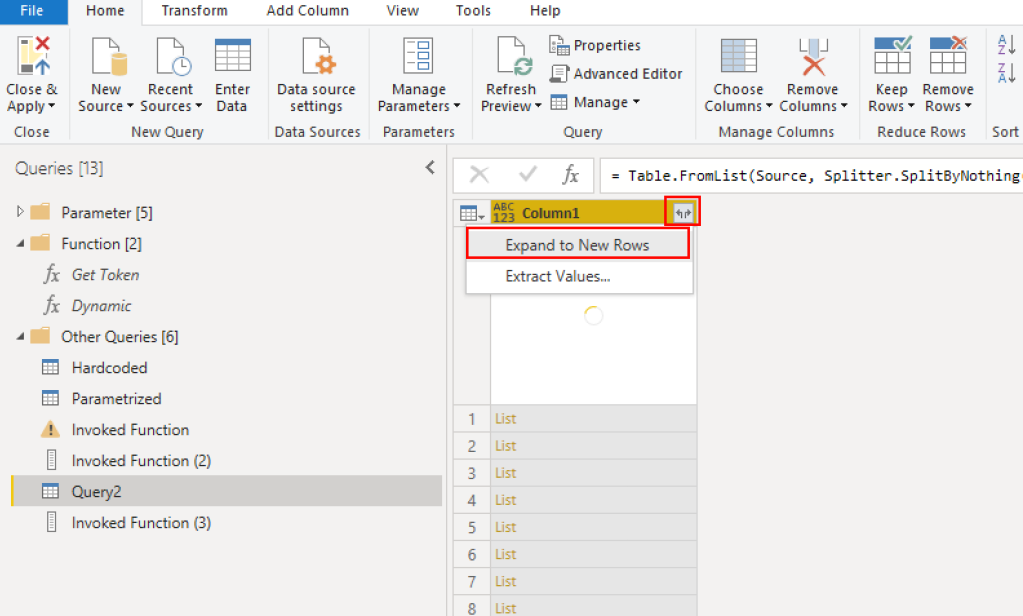
On the next screen, I select Add new Table, and search for Azure SQL Database.

Once selected, I provide the copied Datamart (Azure SQL) string connection as Server name, select Authentication kind “Organizational account”, and select Next.

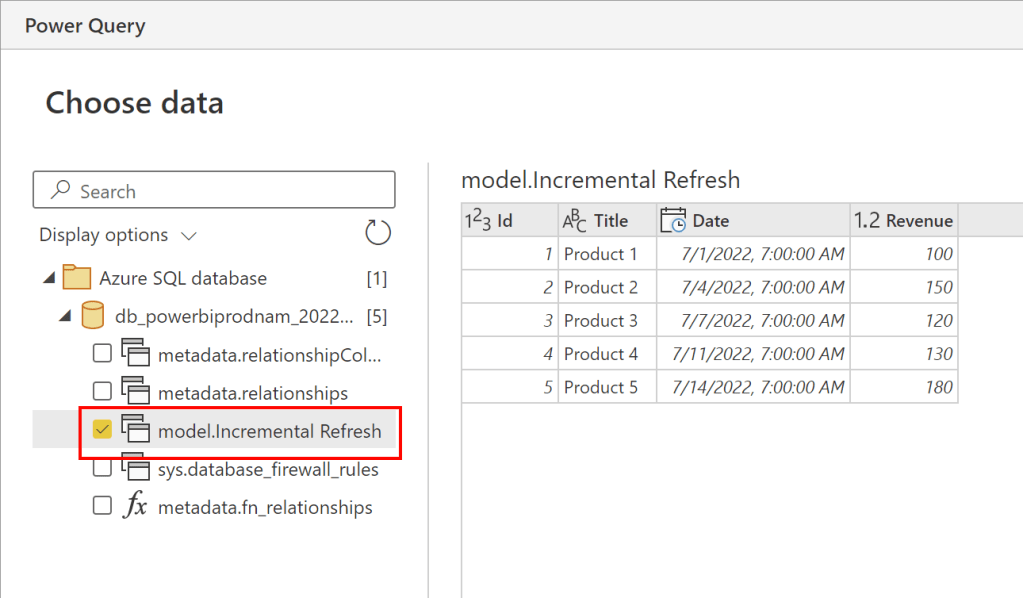
On the next screen, I select my table, and check in the Preview window if the data is correct. Once approved, I select Transform data.

In the Power Query Online experience, I don’t have to adjust anything anymore, but it would be possible if needed. Therefore, I just select Save & close, and save my Dataflow on the next screen with the name “Incremental Refresh”.

As next step, I have to configure Incremental Refresh. Luckily, this is pretty straight-forward. I just select the Incremental Refresh button, turn it on, and choose my Date column within the Dataflow as the DateTime column needed.

Lastly, I configure to store the past 3 years and only refresh the last 7 days. After hitting save I finished the configuration.

Once saved, a window pops up at the top right to Refresh the Dataflow now. I do so by selecting the button Refresh now to load the data into the Dataflow.

It’s time to test

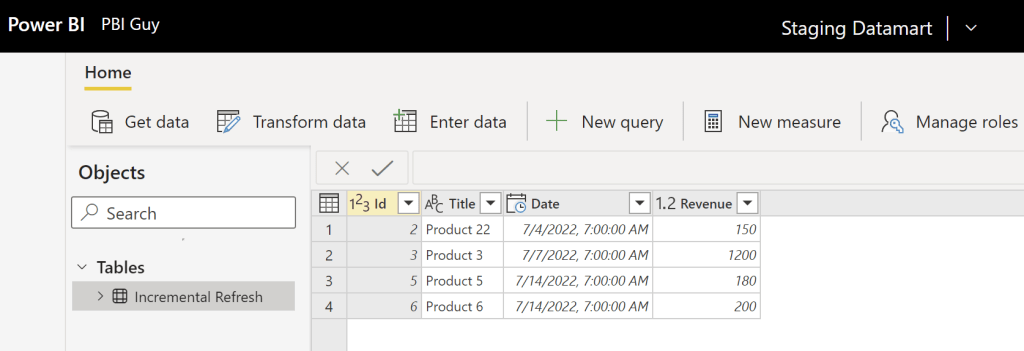
Now that we have set up everything (connecting with a Datamart to our data source, connecting a Dataflow to our Datamart and setting up incremental refresh) let’s test if it works as expected. Today is the 14th of July 2022. In my demo list, I have some sales starting 1st of July until today. If I connect now with Power BI to my Dataflow, I see all five entries coming indirectly from SharePoint – so far so good.

Now, let’s do some changes in the SharePoint list. I will delete two rows, one from the 1st of July and one from the 11th of July. Further, I changed Product 2 name to Product 22 on the 4th of July and updated the Revenue on the 7th. Lastly, I added a new sale for today.

Our first step is now to trigger a refresh for our Datamart. Once the refresh successfully finished, we see a 1:1 copy of our SharePoint list.

Now, let’s trigger a refresh of our Dataflow. Once it’s finished, I hit the refresh button in my Power BI Desktop, which is connected to the Dataflow, to see the end result.

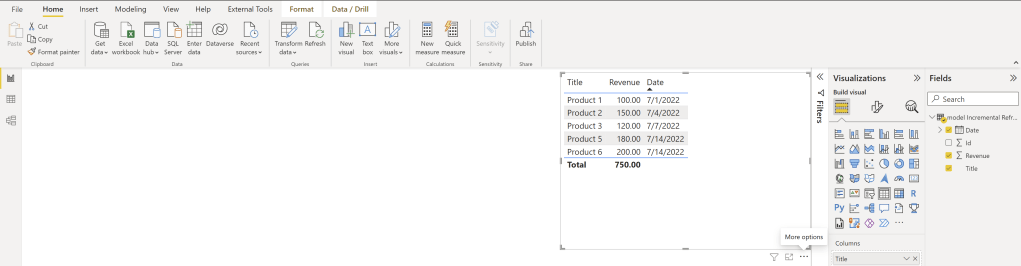
And as expected, Product 1 and 2 haven’t changed! So, we have now some historization in Power BI – awesome! But let’s analyze each row to understand the behavior.

Because we set up the Incremental Refresh to refresh only the last 7 days, everything prior to it will be ignored. Because Product 1 and 2 are older than 7 days, the changes didn’t affect our data in the Dataflow. But what about Product 3 which is dated 7th of July? This is, from an Incremental Refresh Point of view, 8 days ago because

  • 14. July = Day 1
  • 13. July = Day 2
  • 12. July = Day 3
  • 11. July = Day 4
  • 10. July = Day 5
  • 09. July = Day 6
  • 08. July = Day 7

and therefore, 7th July hasn’t been updated neither in our refresh. Product 4, which was dated on the 11th of July, has been removed – this is as expected. And lastly, our newest sale from today has been added (Product 6) which is also as expected.

Great, this is a real game changer as with Power BI you can now create a real staging area, and on top use Incremental Refresh to historize your data! But keep in mind, with this approach the data will only be available in the Dataflow. I would highly recommend using at least your own Azure Data Lake Storage Gen2 to store the Dataflow into it (see https://docs.microsoft.com/en-us/power-bi/transform-model/dataflows/dataflows-azure-data-lake-storage-integration). This way, you can access and enhance it if needed. Further, you can do backups and make sure it will not be lost if you delete your Dataflow.

Please let me know if this post was helpful and give me some feedback. Also feel free to contact me if you have any questions.

If you’re interested in the files used in this blog check out my GitHub repo https://github.com/PBI-Guy/blog

How to loop through an API with Power BI without knowing last page

Recently a customer reached out to me with a challenge because he knows I love challenges and especially solving them. In his case he got access to the Clarksons Research API, and he would like to connect with Power BI to it. So far so good, pretty straight forward. But in his case the API provides a maximum number of rows per page, and it doesn’t provide you how many pages they are in total. And obviously this can change in future as more data will be available through the API, so he’s looking for a dynamic approach to loop through the API, get all data from all pages, and import it into Power BI. Now we have a challenge and I’m happy to walk you through my solution approach and how it can be solved.

Setting the scene

As described above, we’re going to use the Clarksons Research API. Our goal is to connect with Power BI to it and get all data available in a dynamic approach. Meaning if more (or less) data will be available in future, the automatic refresh should dynamically react and get everything available.

First Steps

My first step was to connect with Power BI to check if a connection is in general possible. Once logged in in the Clarksons Research API we can even find an example code how to connect with Power BI to it – nice!

Following this approach, we first have to set up a dynamic authentication. This means we have to request a token which can be used to authenticate against the API. Because the token expires after a while, we have to create a function which will be called to generate each time a new token. This is also well documented above in the “Set up a dynamic authentication”, so I’m going to use the same code. To create the function I’m opening Power Query, select Get Data, and choose Blank Query. Once loaded, I select Advanced editor and copy & paste the code.

let
    Source = () => let
        url = "https://www.clarksons.net",
        body = "{""username"": ""YOUR_USERNAME"",""password"": ""YOUR_PASSWORD""}",
        Source = Json.Document(Web.Contents(url,[
                
            Headers = [#"accept"="application/json" ,
                        #"Content-Type"="application/json"],
            Content = Text.ToBinary(body) ,
            RelativePath="/api/user/ApiAuthentication/GenerateAuthenticationToken"
                ]      
            )),
        access_token = Source[token]
    in
        access_token
in
    Source

First thing I do is to test if I get a token from my newly created function. So, I select it, rename it to “Get Token” and hit Invoke. We got a big string back which represents the token, so my function works.

Obviously, I have to provide a username and password in the function (I marked the part red in the screen shot above). To make my life easier, so that I don’t have to update username and password every time in the code once I change my password, I created two text parameters which will hold my values. To have a better structure in Power Query I created two folders to hold Parameters and Functions. This is purely for structuring my Power Query and has no effect on the code. Afterwards, I add the two new parameters in the function replacing the hardcoded values.

A quick test by invoking the function again shows that the function still works, and I get a token back. I copy the token as I need it in a few seconds again.

As a next step I can now call the API and authenticate with the token from the function. I used the Web connector, entered the example URL https://www.clarksons.net/api/vessels?Page=1&PageSize=20 and selected Advanced at the top. The reason is we have to add a HTTP requests header parameter and provide the embed token. This is simple done choosing advanced, add Authorization as parameter name at the bottom, and add the value “Bearer ” followed by the token copied previously. Attention, there is an empty space after Bearer which is required!

Once done, I hit ok and choose Anonymous to connect. Now I got the first 20 rows coming from the API.

My first test worked perfectly fine, but I need to add one more parameter into the M-Query. I hardcoded the token in the request, but I want to get it dynamically as it can expire, and I don’t want to provide it manually every time. So, I choose Advanced Editor and add the function into the header’s details of my request. On top, I have to specify a RelativePathURL otherwise my dataset will not refresh. This means my whole M-Code looks now as following (top is how it looked, bottom shows my new code):

So far so good. This means I can now connect to the API, get a result, and the embed token will be dynamically created and provided. Now I have to get all the data and not just the top 20 rows.

Understanding the API

As I don’t get an indication how much pages there are and how many results per page I can get (unfortunately the documentation is not really good…), my next step is to further parametrize the request so I can test out the limit of the API. To not lose my work done so far, I copy the whole M-Query of my request, select Get Data, choose Blank Query, and paste the whole Query. This way I have now two tables. I rename one to “Hardcoded” and the other one to “Parametrized”. This way I can always check the result and make sure the API provides me the right data.

As my next step, I create two new Parameters called Page Number and Rows, both are Decimal Number value Parameters. For Page Number I enter 1 (for first page) and for Rows I enter 20. This are the values we see in the Relative Path URL. In my first try I want to make sure I’ll get the same result as the Hardcoded one. Afterwards I update the M-Code and parametrize the RelativePathURL as following:

Once I hit enter, I got an error message saying Power Query can’t apply the & operator to type Text and Number.

Because we decided to set our Parameters as Numbers, Power Query can’t combine now a Number and Text. This means we have two options now: modify the Parameter to be Text or transform in our M-Code the Parameter to be text. I choose the second option, as there is a Number.ToText() function in M so I update my code as following:

After hitting the done button, I see the same result as the hardcoded one – perfect! Now let’s test how many rows I can back per page. By just updating the Parameter “Rows” with a new number, I see a bigger result set. Once I add a too big number Power Query will return an error. After trying some different numbers, I figured out the maximum rows per page is 1000 in this case. So, I let the parameter Rows be 1000.

Next, we have to figure out which is the last page currently. Same procedure, I update the Page Number Parameter until I get an error or empty result and figure out what the maximum number is. In this case the last page is 202. This means if I get 1000 rows per page, there are 202 pages in total (so roughly 202’000 rows), and if I configure the parameter to 203 pages, I get not a “real data row” back.

Now I know how I can call the API, how many rows per page I can get back, and how many pages there are currently.

The dynamic approach

Till now I’m calling the API hardcoded through parameters. But what if I can call the API multiple times and combine the output together to one, big table? Of course, this would work manually by adding for each new page a new query, but that’s not really efficient (as Patrick LeBlanc from Guy in the Cube says: I’m not lazy, I’m efficient!). Therefore, I’m going to create another function which will call the API. In the function itself I’ll provide a parameter which will define which page I wish to call. For example, if I provide the value 1, the first page of the API should be called giving me the first 1000 rows back. If I provide the value 2, the second page of the API should be called giving me the second 1000 rows back, etc. To not lose my process so far, I create another Blank Query (select New Source, Blank Query), rename it to Dynamic, and open the Advanced Editor. In there I copy and paste the first line of the Parametrized table M-Code – see screen shot below. The upper M-Code shows the Parametrized table, the lower shows the new Dynamic M-code.

Now I’m going to create a function out of it by simply putting (page as number) => at the top. This means my new function will expect a number parameter called page as input.

Lastly, I have to make sure the provided input will be hand over to my API call. Therefore, I have to update the piece of code where I’m providing the Page Number as previously created Parameter and replacing it with the page parameter from the function.

Now I have a function and if I enter a number, a new table will be created with the current data from the provided page.

As we can see there is still some work to do to get one, nice, and clean table. I’m interested only in the “results”, so I select “List” to navigate further. And because I’m efficient, I open again the Advanced Editor and copy the newly created step to paste it into my function as well. This way I don’t have to navigate in my table, but the function gives me already back what I’m looking for. If you do this, don’t forget to add a coma at the end of the “Source” line.

To make sure it works I test it by invoking the function again and yes, it works.

As next step I create a list with one row, each row with one number counting onwards. In Power Query there is a function for that called List.Generate() Let’s test it by creating a list with number from 1 – 10.

First line defines where the list starts (number 1), where it should end (10), and in which steps it should increment (+1 for each new row). Once done, we have to convert the list to a table. This is pretty straight forward in Power Query by selecting the List, hit Transform Menu in the Ribbon, and choose “To Table”.

On the next screen we just confirm by selecting OK.

Now I want to test the Dynamic function by invoking it in my new generated table. This way the function will be called for each row, therefore each number will be provided to the function as page, and if everything works as expected I’ll get 10 pages back each containing 1000 rows. To do so I select Add Column in the Ribbon and choose Invoke Custom Function. I name my new column “Result”, select Dynamic as function query and hit OK.

Awesome, I got a result per number (page) as List. This means now I would just need to transform my data to extract the result into one big table, but I still have the issue that my approach is not dynamic. I hardcoded the list numbers to start at 1 and end by 10 but we have 202 pages. Of course, I could hardcode that (or pass the parameter) to create a list, but it’s still hardcoded. I wish to create a list until no pages are available. Luckily, the List.Generator() provides a function to test against a condition and until this condition is true, it will create new rows. Once condition is not true anymore, it will stop. In this case my condition should be something like “create a new number / row per page coming from the API until I don’t receive any rows / page from the API anymore”. Let me first test what I get back if I provide the number 203 in my Dynamic function because it doesn’t exist. Once done, I see the result is empty.

This means I can check if the result is empty and if so, stop creating new rows. In M-Code this will look as following:

List.IsEmpty([Result]) = false

Further List.Generator() asks where to start the list. I wish to provide that dynamically coming from the API but also want to make sure that if no page is available no error will occur during refresh. So, I have to try if I get something back for page number 1 (that’s where I start) calling my Dynamic function and if not, give me null back. On top I have to create a parameter indicating that I start at page number 1 which I’ll use afterwards to count onwards until we reach the end. I’m saving the whole result in my step called Result. This piece of code looks as following:

[Result = try Dynamic(1) otherwise null, pagenumber=1]

The next function in List.Generator() is creating the next row in the list if the condition is met. Again, I’m wrapping the Dynamic function around Try Otherwise to make sure no error will occur if somehow the API is not reachable and providing now the pagenumber parameter. And if successful, please count +1 in my pagenumber parameter for the next page. This piece of code looks as following:

[Result = try Dynamic(pagenumber) otherwise null, pagenumber = [pagenumber] + 1]

Lastly, I wish to get the Result back, so I provide the optional function in List.Generator() providing just [Result]. This means my whole code now looks as following:

let
    Source = List.Generate(
        () => [Result = try Dynamic(1) otherwise null, pagenumber=1],
        each List.IsEmpty([Result]) = false,
        each [Result = try Dynamic(pagenumber) otherwise null, pagenumber = [pagenumber] + 1],
        each [Result]),
    #"Converted to Table" = Table.FromList(Source, Splitter.SplitByNothing(), null, null, ExtraValues.Error),
    #"Changed Type" = Table.TransformColumnTypes(#"Converted to Table",{{"Column1", Int64.Type}}),
    #"Invoked Custom Function" = Table.AddColumn(#"Changed Type", "Result", each Dynamic([Column1]))
in
    #"Invoked Custom Function"

If I hit now Done, Power Query should loop through the whole API, going through each page and create a new row for each page in my automatic created list. For each row it will call the API to get the data. Let’s test it.

Once finished (this can take a while now!), I get an error in my query. The reason is because I did some transformation and Power Query can’t do them anymore. So, I’m deleting all steps until I see no error and extract now everything to New Rows by hitting the two arrows icon in the column.

Next, I expand the Records by again hitting the two arrows icon, select all columns I wish to include (in my case all of them), and uncheck the “Use original column name as prefix”. By hitting ok, I have now my complete table with all data from the API!

Obviously, I can do now all kind of transformation I wish and need to do, and – even more important – set the correct data types for each column as well as following best practices approach once it comes to data modelling. Before I hit the Close & Apply, I rename my “Dynamic” function to “Get API Page”, delete the unnecessary Invoked Function lists, and rename my finale table to “API Table”. Of course, you can choose another name, whatever suits you best. Lastly, I right click on my Hardcoded and Parametrized table and deselect the Enable load option to not load the data into my data model but still to keep my queries. If you don’t wish to keep them, just delete them as well.

Once done, I hit the Close & Apply button and wait until the table is loaded. If you keep an eye on the data load dialog, you’ll see the rows loaded are increasing every time by more or less exactly 1000. This means or paging from the API works (remember our Rows parameter in Power Query?).

One last tip before you leave. If the data load takes too much time and your token expires (remember, we have to get a token to authenticate against the API and this token has a lifespan) during the refresh, you can probably test the timeout of the token in the request. This means you have to update the function by adding the timeout at the end of your URL request and increase the lifespan. In my case this would work as the API provides a timeout function and therefore it would look like following (don’t forget to add the coma after the relative path):

Please let me know if this post was helpful and give me some feedback. Also feel free to contact me if you have any questions.

If you’re interested in the files used in this blog check out my GitHub repo https://github.com/PBI-Guy/blog