Note from PBI Guy: A few weeks ago I had the pleasure to meet Manel Omani, a colleague of mine, who presented a super interesting solution how she’s tracking Power BI Capacity overloaders via Power Automate and notify automatically the Dataset owner. I thought this has to be shared with the Power BI community and asked here to create a blog post about it. Luckily, she agreed and I’m happy to share the result here.
As a Power BI Capacity administrator, have you ever experienced multiple slowdowns and noticed that too late ? This is a very common issue that capacity administrators face when they track and monitor the usage of memory/CPU of the artifacts. Thankfully, in the capacity setting we still have the possibility to set notifications whenever the load reaches x%, or when it exceeds the available capacity. This notifications are helpful to detect the slowdowns early on, but do not really help to highlight which artifact is consuming more resources than the others. To get this information, you need to check it on “the Premium metrics app”.
The idea of this article is to propose ways to combine the Premium metrics app and Power Automate in order to set notification to the owner of the artifact causing slowdowns on the capacity so that they can work on optimizing their data model and prevent future slowdowns.
Overloaders detection on Power BI Premium: the approach
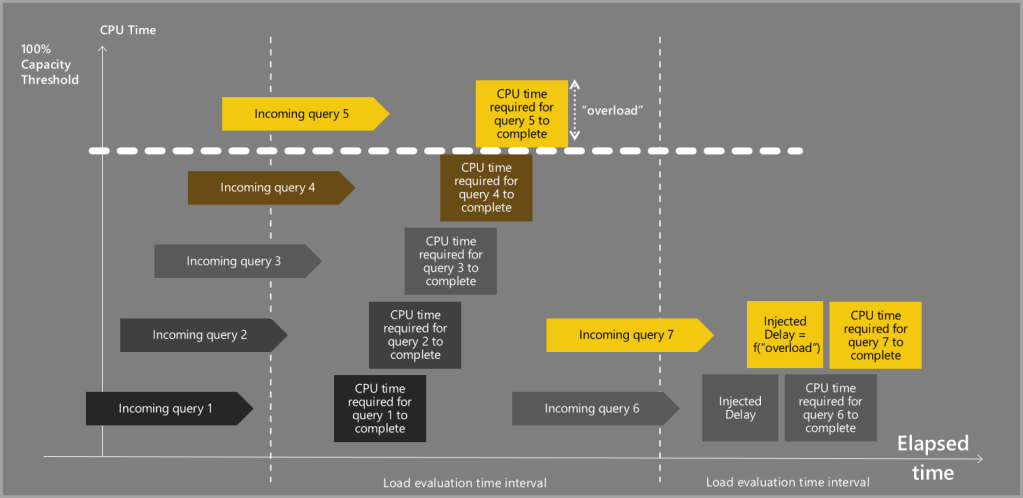
Capacity overload happens when one consumes more CPU in a 30sec interval than what the capacity allows. For instance, if you have a P1 capacity, you can consume 8 cores * 30 sec = 240 sec of CPU time. If you exceed 240 sec CPU time in a 30 sec interval, all the queries that follow with be delayed.
This overload can be detected on the Premium metrics app on the CPU% chart.
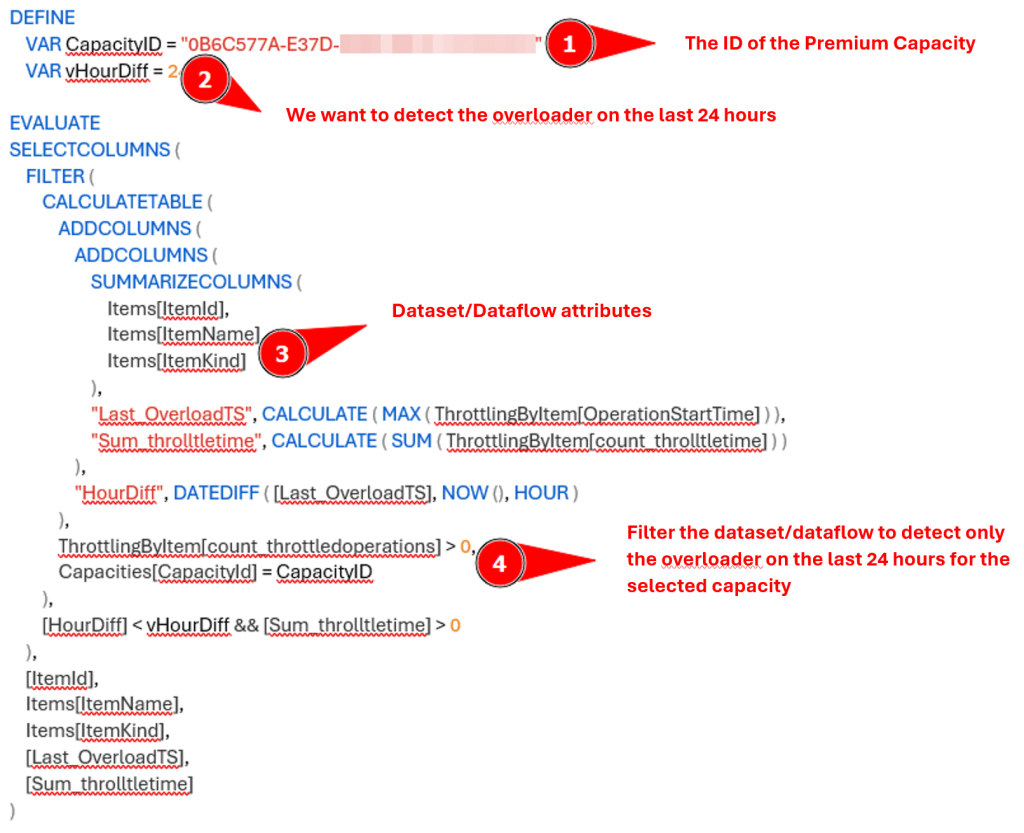
And from the Premium metrics app dataset we can run the following DAX query by using DAX Studio to get the list of overloaders IDs:
Keep in mind that your workspace have to be backed up by a capacity to be able to connect with DAX Studio to your Dataset and execute the statement.
This DAX query gives us the list of artifacts that has raised an overload in the last 24 hours. The results are as follows:
This DAX Query is run on the Data Model of the Premium App Monitoring. Please note that this DAX query may need to be changed if the data model of the App Monitoring is updated.
Now that the overloaders are identified, the objective is to get the owner of these artifacts and the details behind the overloading. As the Premium Capacity app does not hold this data, we need to find another approach to retrieve the owner of the dataset. One way is to use the Power BI Rest API: https://api.powerbi.com/v1.0/myorg/datasets/{datasetId} which can provide the email address of the user who configured the dataset.
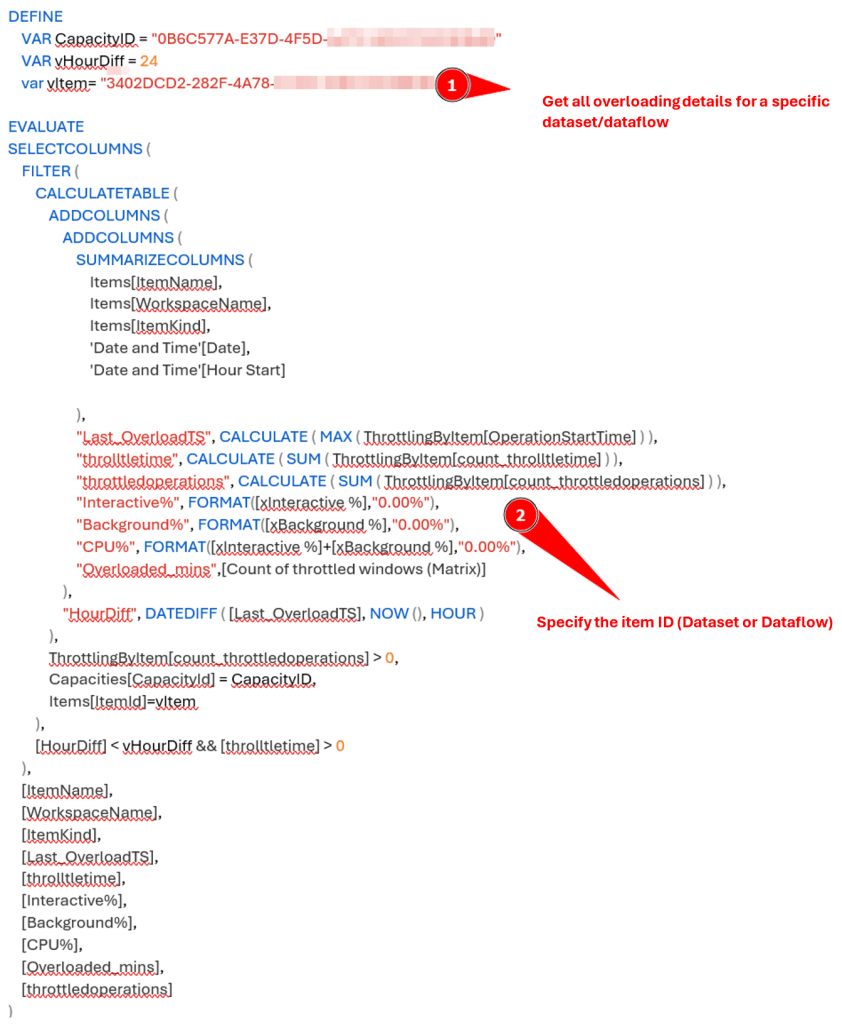
Now, to get the details of the overload, such as “how many times the dataset has raised an overloading” or “how much CPU has been used”, we can run another DAX query over the Premium App monitoring dataset as follows:
The results can be seen below:
With all these information, we can notify through email or a Teams message, the owner of the dataset (extracted from the Power BI rest API), with all the required information to handle the overload. It is also possible to save all these information periodically (in a Blob storage, DWH, CSV files, etc.), so that we can analyze the “bad students” of the Premium capacity and help them optimize their data model.
Overloaders detection on Power BI Premium: Setting the scene with Power Automate
For this example, we are going to use Power Automate to automate the e-mail/Teams notification to the owner of dataset who caused an overload in the last 24 hours with all the dataset consumption details.
Please note that Power Automate offers many ways to send notification or to store the data collected.
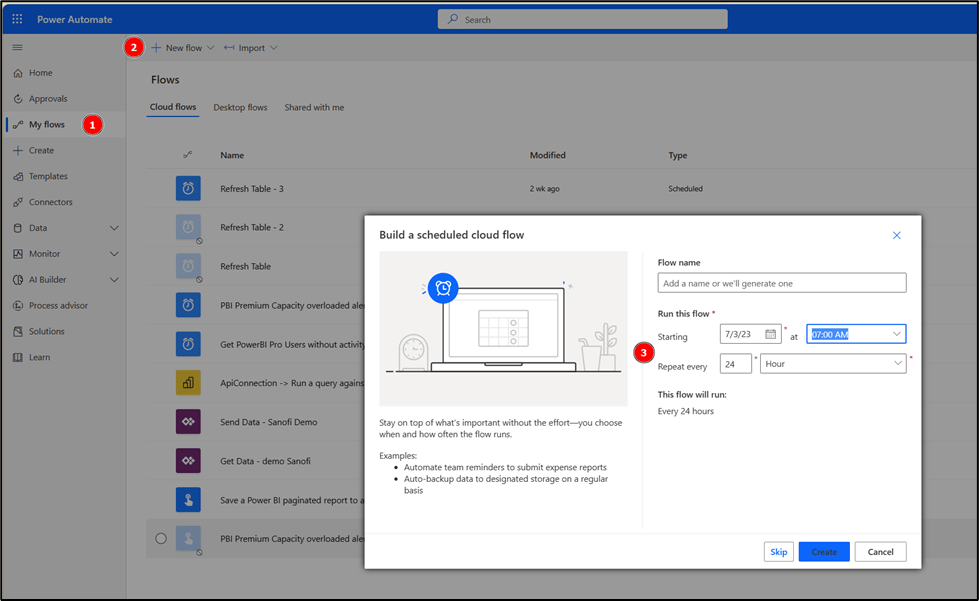
Once I logged into Power Automate, I will start by creating a flow with a scheduled Cloud Flow. The idea again is to run this flow each morning to see the overloaders of yesterday:
Let’s first create 3 variables that will help us later with our configuration:
The first variable “CapacityName” will store the Premium Capacity ID
The second variable “timeDiffrence inHours” will store how many hours I want to look at ( in my case, I’m using 24 hours)
The third variable “Overloader details table” is an empty array that will be used to store the overloading details of each dataset so we can use it to send that to the owner.
After the creation of these variables, we will run our first DAX query in Power Automate by using the “Run a Query against a Dataset” Power BI action as follows:
Now that we have the IDs of the dataset that has caused an overloading in the last 24 hours, we will need to get their owner.
You can find all the details of creating such connector on this article: Power BI – Custom Refresh with Power Automate It’s not required to go through a Custom Connector. You could also use the HTTP Action but for reusability purpose it’s much easier with a custom connector.
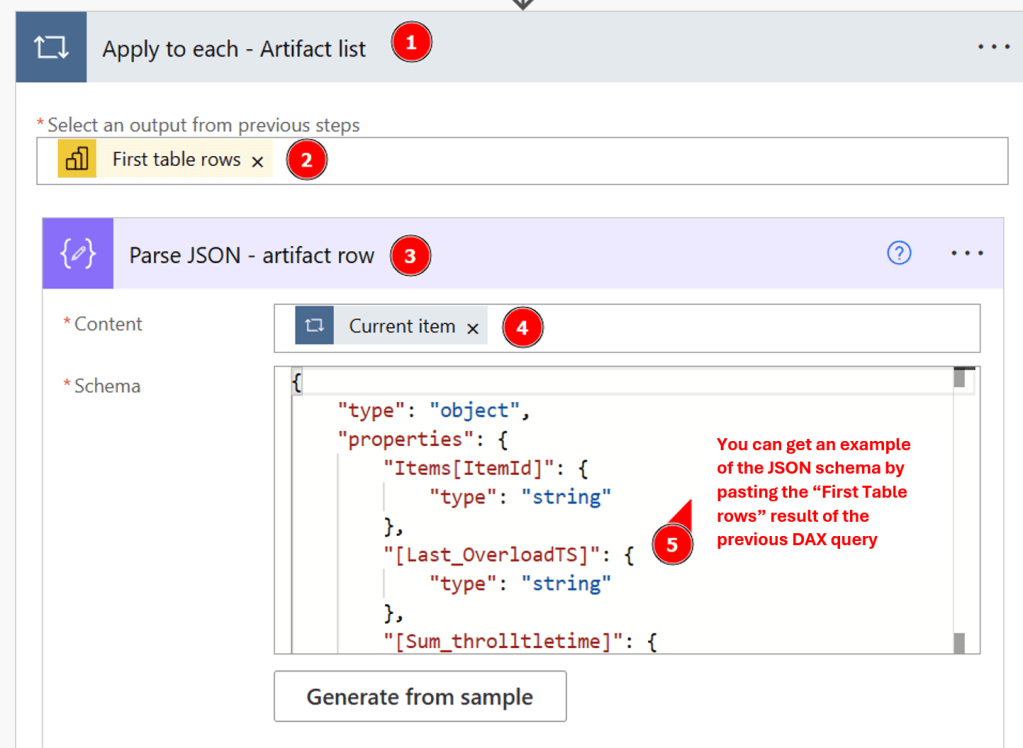
The “run a query against a dataset” action will return a JSON list that contains the IDs of the dataset. We will need to loop on each row in order to get their owner and run a second DAX query that will retrieve the overloading details. To do so, we will use “Apply to each” action in the flow and parse each “First Table rows” as follow:
After parsing the result of the DAX query, we will call the custom connector created earlier in order to get the owner of the dataset:
Now that we have the ID of the dataset parsed (Items[ItemID]) and the Owner of this dataset (ConfiguredBy), we can run our second DAX query to retrieve the details of overload of this dataset as follows:
Same thing here, we will need to parse the query result and use it to initiate our Table variable that will hold the throttling details for each dataset:
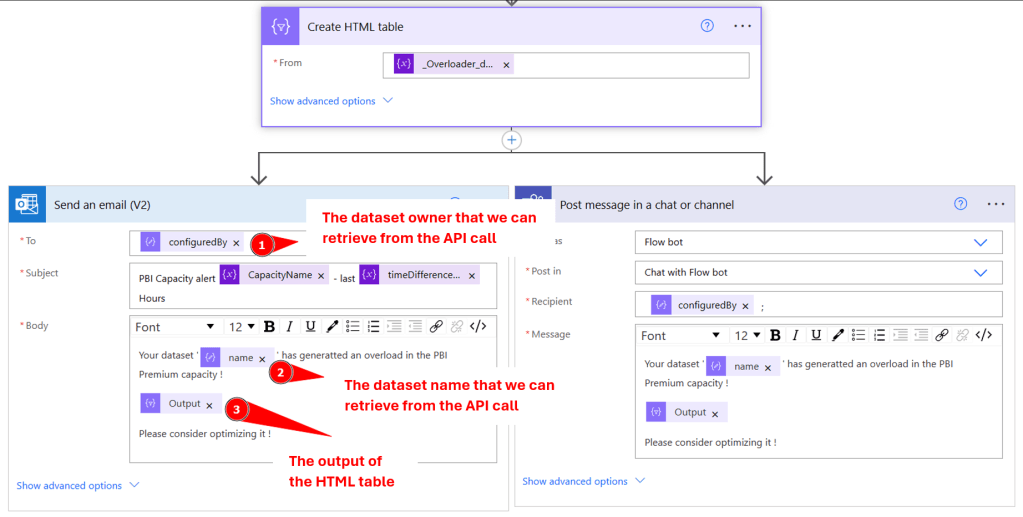
Now that we parsed our data and initiate a Table variable with the throttling detail (for only one dataset), we will create and HTML table that we can use in order to notify the dataset owner with the overloading that he created. Here you have the choice to either send and e-mail or Teams message, or even store the result in a SharePoint or Blob Storage:
The full flow is presented as follow:
For this, we just used some DAX statement to identify the overloaders and combined the information afterwards with a REST API call to retrieve the Dataset owner. Obviously, there are multiple ways to achieve the same goal but I hope I showed you in a low-code manner how to achieve this goal.
Please let me know if this post was helpful and give me some feedback. Also feel free to contact me if you have any questions.
This blog post is a little bit special to me as the whole idea and text is not coming from myself but from my good friends Dirk Gubbels, Principal Consultant at Microsoft, and Gabi Münster, Fabric CAT/Senior Program Manager as well at Microsoft. They approached me asking if I would be willing to share the solution on my blog and how can I say no to such a request? 🙂 Feeling even honored that they considered my blog for their idea, I’m happy to share their walk-through how to start a job after a Power BI Dataset has been refreshed.
In some business cases, there may be a requirement to perform a number of tasks as soon as a Power BI Dataset has been refreshed. This can be sending out an email, starting another Dataset process, or rendering and distributing reports. This blog post will show in detail how this can be done.
Requirements
For this to work, the following components will be created:
A Power BI Report with
A Power BI Dataset, which process will trigger the task
A page with a card showing data related to the last refresh time
A Power BI Dashboard with a time containing information on the time of the last refresh
A data Alert that will trigger when the Dashboard tile changes
A Power Automate Flow to execute the required task
Each of the components will be described in detail.
Step 1: The Dataset
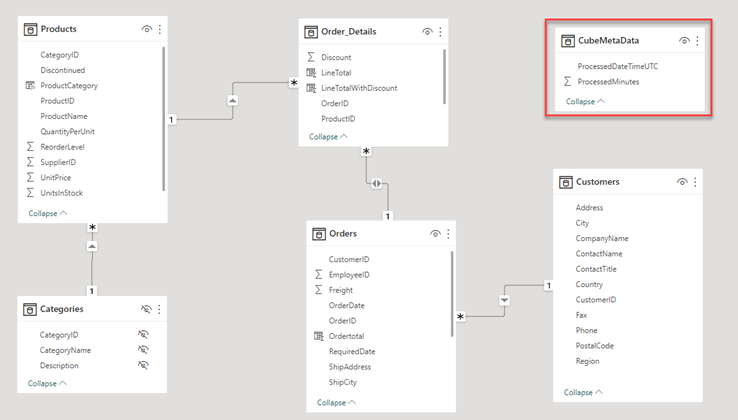
Any dataset can be used for this. In this example the dataset fetches data from the public northwind OData service at https://services.odata.org/V3/Northwind/Northwind.svc/ To have a few tables and data for the report, the following model is created:
Important: To enable the rendering of the report when the Dataset is refreshed, an extra table named ‘CubeMetaData’ is created, using the following M code:
let
    Source = #table({"ProcessedDateTimeUTC", "ProcessedMinutes"}, {{DateTimeZone.FixedUtcNow(),Number.Round(Duration.TotalMinutes( Duration.From( DateTimeZone.FixedUtcNow() - DateTimeZone.From("2020-01-01 00:00:00 +00:00")))) }}),
    #"Changed Type" = Table.TransformColumnTypes(Source,{{"ProcessedMinutes", Int64.Type}, {"ProcessedDateTimeUTC", type datetimezone}})
in
    #"Changed Type"
The 2nd column is needed to set the data alert, as currently data alerts cannot be set on date or datetime values. Therefore, a column with a numeric value must be created.
Step 2: Visualizing the processed date
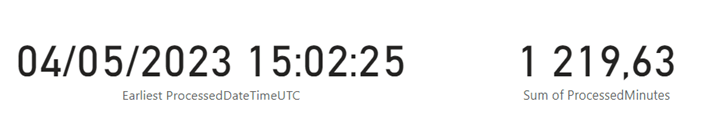
In the Power BI report containing the dataset, create a page with 2 card visuals, one showing the ProcessedDateTime column and one showing the ProcessedMinutes column. This can be sum or first, does not really matter as there is only 1 row anyway. Make sure the card showing the processed minutes does not use any display units. The full detail of the number needs to be visible.
The left visual will not be used, but is added for troubleshooting purposes, to see if the cube was processed.
Step 3: Save and publish the report
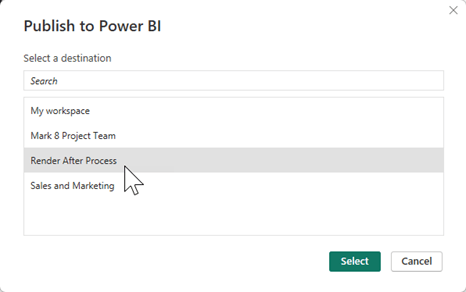
Save the report and publish it to a workspace on Power BI.
Step 4: Create a Dashboard
The Power Automate Flow will be triggered by a data alert in Power BI. These data alerts are only available on Dashboards. So, the next step is to create a Dashboard with a single tile referring to the refresh date/time of the cube.
Open the report that was just published:
And pin the visual showing the numeric value of the processing time to a new Dashboard:
After creating the dashboard, open it.
Step 5: Create a data alert
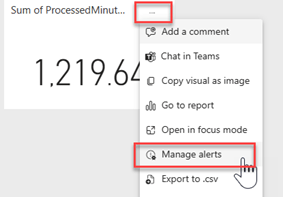
On the Dashboard, click the ellipsis button at the top of the newly created tile showing the processed Datetime: If the ellipsis button (…) is not visible, try changing the size of the tile.
Choose ‘manage Alerts’ to create a new data alert, and click the ‘+ Add alert rule’ button. The alert should look similar to this:
The alert condition will always be true, but because the alerts are only sent when the data changes, this effectively becomes an alert sent on data change. The data will only change when the cube processes.
Step 6: Create the Power Automate Flow
With the data alert is set up, it is now possible to start a Power Automate Flow when the alert is triggered. To do this, either click the link at the bottom of the data alert details, or navigate to https://powerautomate.microsoft.com/
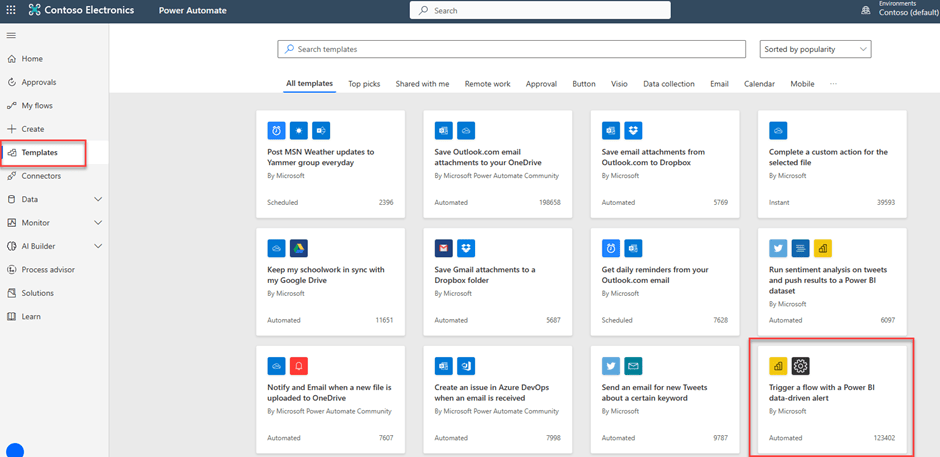
Sign in and select ‘templates’ at the left side of the screen. The template ‘Trigger a Flow with a Power BI Data-driven alert’ should appear on the bottom right of the screen. If it is not visible, just search for ‘Data driven alert’.
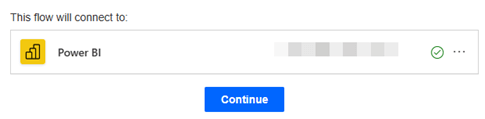
Select the template. On the next screen, you may be asked to validate the connection to Power BI:
Validate this and click continue. The flow editor opens.
To test the solution, process the Dataset. Before the Dataset can be processed, the credentials need to be set. In this case, we’re using an anonymous OData feed. Go to the settings of the Dataset and click ‘edit credentials’ on the data source credentials.
Once this is done, the dataset can be refreshed.
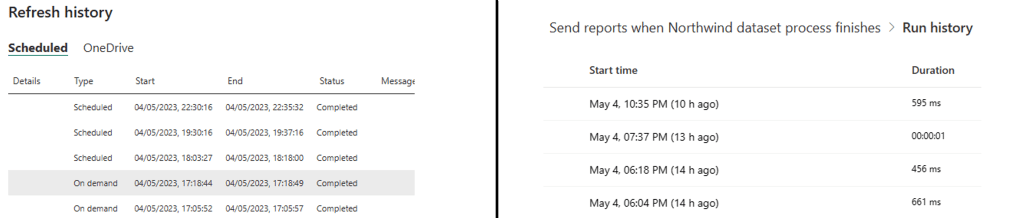
As the alert will be triggered maximum once per hour, it is best to schedule a few automatic refreshes with a few hours in between, and compare the refresh history with the flow execution history:
This shows there is around a 5 – 7 minute delay between the refresh finishing and the Power Automate job starting.
Alternatively, a similar result can be achieved using Scorecards and Goal instead of a Dashboard and a tile.
Add-on from PBI Guy: You could also trigger a Dataset refresh via Power Automate and use the REST API to check the status of the Dataset Refresh. Once finished, the Flow could proceed and send as well an e-mail or whatever is required. This way you would have more control over the whole process, but would require more skills to call the Power BI REST API. Lastly, you could also create more complex rules by executing DAX statement against the Dataset via the REST API or Power Automate and check tresholds in Power Automate to trigger an e-mail alert.
Limitations
Please be aware that Data Alerts currently are not triggered if you refresh the Dataset using the XMLA endpoint or the enhanced refresh API.
Conclusion
The steps above explain how to create a Power Automate Flow that is executed after a Power BI Dataset is refreshed. This opens the door for many different business scenarios of tasks that need to run as soon as new data is available in a Power BI Dataset.
Once more, thank you very much for these insights Dirk and Gabi and I hope we’ll collaborate even more in near future!
Please let me know if this post was helpful and give me some feedback. Also feel free to contact me if you have any questions.
Working with Data Scientist I got quite often the question if Power BI is able to trigger a Python (or R) script to recalculate scenarios and show the result more or less immediately in Power BI again. On top it would be great to be able to pass parameters from Power BI to Python so an user can influence the script. As you guessed it right – because I’m writing this blog post – it is possible! But not purely with Power BI but rather in combination with other (Microsoft) services.
First things first
Before I deep dive into a solution, I want to make sure a common understanding of the issue is given. First of all, Power BI is a reporting tool. As such, it relies on data sources to be able to connect to some kind of table and visualize the result. It is a purely “read-only” visualization and not a “writeback” tool. Therefore having some kind of input mechanism, to be able to pass parameters to a Python script in our case, does not work with purely Power BI.
Further and as already mentioned, it has to connect “to something”. This means we can not execute a Python script on the fly and check the result. Yes, you can use Python in a visual and do some kind of visualization on the fly, but that’s in most cases not sufficient as just a few libraries are supported (https://learn.microsoft.com/en-us/power-bi/connect-data/service-python-packages-support). Yes, you can also have Python as Data Source, but to be able to recalculate a new scenario you would need to refresh the Dataset every time. Imagine multiple users accessing the same report and one of them is triggering a Dataset refresh – this will for sure lead to confusion for other users if the data changes while accessing the report. Therefore we’re looking for a way to independently run a script, store the result in a way Power BI can access and show it in near-real time, and on top pass parameters from Power BI to the script.
Which services to choose
Let’s go step by step and see which service we can use. First of all, we need a Python script. As you probably have noticed, I’m a big fan of Azure Synapse so let’s use the Notebooks from there and write our Python code in PySpark. The result has to be stored somewhere so Power BI can access it in near-real time. This means the data source has to support DirectQuery, otherwise we would need to refresh the Dataset every time the script runs. Thus, Azure SQL dedicated pool would be a great choice, but on the other hand I would need to make sure it’s running while users are accessing the report. So I’ll focus on a more cost-effective way and try to use SQL Serverless. As you can connect to files through SQL Serverless and run SQL queries on top, I will save the result from my Python script as parquet files in my Azure Data Lake Storage Gen2.
Next, I have to make sure my Python script can be executed whenever needed. This requirement can be fulfilled by using Synapse Pipelines. This way I can call the Synapse Pipeline REST API and trigger a run whenever needed. Further, Synapse Pipelines can be parametrized and those parameters can be passed further to the Python script. On top, I can also pass the Pipeline Parameters through the REST API – perfect!
As a last step, I need some kind of input mechanism in Power BI to be able to influence the parameters and trigger a Synapse Pipeline run. For such scenarios, Power Apps is the right choice! Microsoft offers an out-of-the-box visual which can be used to integrate a Power Apps app providing input fields. Further, a button can be defined which will trigger a REST API call or – even better and more scalable – trigger a Power Automate flow which will trigger the Synapse Pipeline.
Here’s an overview of all the services mentioned and used in this solution:
Power BI
Power Apps
Power Automate
Azure Synapse
Synapse Pipeline
Synapse Notebook
Azure Data Lake Storage Gen2
SQL Serverless Pool
The main idea of this blog post is to showcase that, in general, it is possible to trigger a Python (or R) script from Power BI. Looking from a performance point of view, I wouldn’t choose Synapse Pipelines but rather Azure Functions as it will execute the Python script much faster. Further, in a production environment, I would store the result in a SQL Dedicated Pool (or Azure SQL) and not go through the Serverless one as the performance can be influenced much better rather then connecting to parquet files. Lastly, creating multiple, small parquet files in ADL Gen2 is also not considered as best practice but rather creating fewer but bigger files. On the other hand going through Synapse Pipelines showcase the scalability of the whole solution.
Let’s roll up our sleeves and get started
Let’s start by creating a simple Python script which takes two numbers as parameter and add them up. Because the report will be used by multiple users at the same time, I have to make sure on one hand that the different calculated scenarios will be stored properly and on the other hand users will identify their scenario. For that reason I create three more parameters for User Name, UPN, and timestamp. Those parameters have to be influenced from outside as they are changing depending on the user. But before defining the parameters, I also add the necessary libraries.
#Import necessary tables
from datetime import datetime
import pandas as pd
#Define standard parameters which can be called from outside
firstNumber = 7
secondNumber = 1
user = 'Chewbacca'
upn = 'chewbacca@kbubalo.com'
timestamp = datetime.now()
timestamp_string = timestamp.strftime('%Y_%m_%d_%H_%M_%S')
In my next block of code I define further parameters which should not be influenced from outside. This includes my ADL Gen2 storage account, my container, folder, and file name. I decided to create a folder for each user in which each scenario should be saved to be able to differentiate between the users.
adlgen2 = '...'
container = 'dev'
folder = '15 Demo/Trigger Python from Power BI via Power Platform/' + user
fileName = 'Scenario'
Next, I create a DataFrame to store the parameters as well as the result (adding number 1 and 2).
#Create dataframe with provided data
d = {'firstNumber': [firstNumber], 'secondNumber': [secondNumber], 'result': [firstNumber + secondNumber], 'user': [user], 'upn': [upn], 'timestamp': [timestamp]}
df = pd.DataFrame(data=d)
Lastly, I store the DataFrame as parquet file in my configured ADLS Gen2.
To make sure my defined parameters can be influenced “from outside” (this means form Synapse Pipeline in this case), I have to mark them as such. Therefore I select the three dots to the block of code and select Toggle parameter cell.
If done correctly, you’ll see a “Parameters” in the bottom right corner of your code block.
Once done, let’s test the script by running it and check if a parquet file is created as wished – looks good! A parquet file is created in my ADLS Gen2 and the result is as expected.
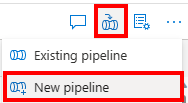
My next step is to create a Pipeline and pass parameters from the Pipeline to my Notebook. In Azure Synapse there is a small icon at the top right to automatically create a Pipeline out of your notebook. I just select it and hit New Pipeline.
The Azure Synapse Pipeline window will open up. I rename my Pipeline to “PBI Guy Trigger Python” and add 4 Parameters by hitting the + New in the Parameters section of the pipeline. Make sure you’re not selecting the Notebook but the Pipeline. I name my parameters like the one in the Notebook and give them a proper type as well as a default value because I want to test my pipeline afterwards making sure the parameters are passed.
The Parameter name do not have to match the names from my Python code but it makes sense to name them the same way.
Next, I select the Notebook activity, choose Settings tab and expand Base parameters. Again, I add 4 parameters and assign the correct type to them. Keep in mind, these parameters have to match exactly with the names from your Python Notebook. Once done, I select Add dynamic content and select my Pipeline Parameter to the corresponding Parameter and hit ok.
Once done, let’s test the Pipeline as well by hitting “Debug” at the top. If wished, you can change your parameters now as a Pane will pop up on the right hand side of your screen. I just confirm by clicking OK. After roughly 3 minutes in my case the Pipeline run successfully and I see a folder with my name including a parquet file has been created. By right-clicking on it and selecting New SQL Script – Select TOP 100 rows I can check the result making sure my parameters has been used in thy Python script – looks good so far! Don’t forget to publish the Pipeline now.
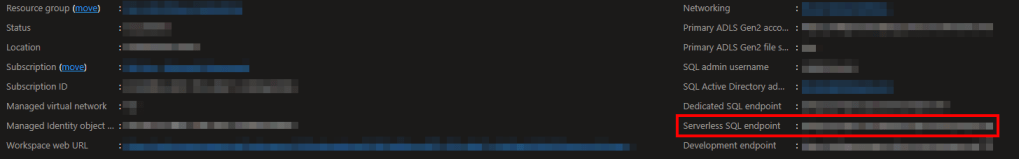
Now, I have to trigger the Pipeline through the REST API. Luckily, Microsoft provides a great documentation here which highlights the REST API call. As we see it’s a POST call to {endpoint}/pipelines/{pipelineName}/createRun?api-version=2020-12-01. {endpoint} in this case means the Development endpoint of my Azure Synapse workspace which can be found in Azure Portal by selecting the workspace in the overview section. You can easily copy it by selecting the copy button right next to it.
To trigger the Pipeline through the REST API I’ll create a Power Automate flow which will be triggered from Power Apps. As I wish to connect the Power BI Dataset with my Power Apps app I have to start in Power BI and create a report on top. For that, I just open Power BI Desktop, create a dummy table by entering a random number into the table, and add the Power Apps Visual. If you need a step-by-step guidance how to create a Power Apps starting in Power BI check my previous blog post here: https://pbi-guy.com/2021/11/17/show-secured-images-in-power-bi/ It will walk you through the most important steps. Further, I’ll focus on connecting to the right data in a later stage therefore the dummy table.
If you have issues in Power BI Desktop and the Power Apps app won’t load try it in the Service. You can easily publish the empty report and modify it from the browser. Once done, you can download the PBIX file again.
Once done, I just add my dummy column into the fields section and hit Create New in the Power Apps visual. This will open a the Power Apps studio where you can create your app. I will not walk you through on each step how I created my app but rather focusing on the most important parts on a high level. If you’re interested in the final solution, you can check my GitHub repo.
I add two Text Input objects as well as two labels making clear what the input should be. Further, I add a button which will trigger a Power Automate flow and provide the values from the Text Input fields as parameters to the flow. Once added, I rename each object making sure each one of them has an appropriate name – this will help me referencing it later on.
In the screen shot above you’ll see some further objects. Those are added to make the app more appealing and are not crucial for the whole process.
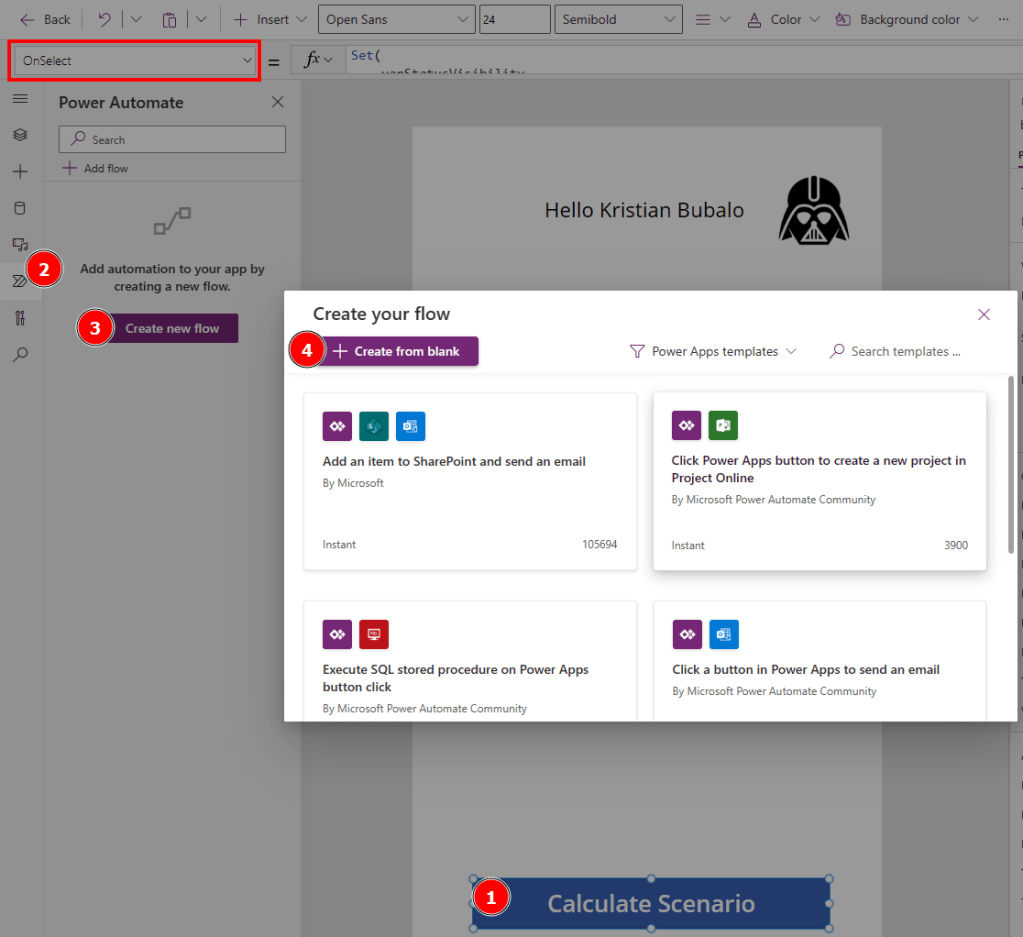
Next, I select the button and make sure the OnSelect property is active (see red box), head over to Power Automate on the navigation pane, hit Create new flow and select + Create from blank.
A new pop up window will appear where a flow can be created. Again, I will not walk you through the whole process of creating the flow but rather focusing on the most important steps. A step-by-step guide how to create a flow and to familiarize yourself with it can be found in one of my previous blog posts here.
The first thing I do is to specify all needed variables. As I wish to call the REST API with a Service Principal, I create one in the Azure Portal (how to create a Service Principal can be found here), give no API permission but rather add the Service Principal as Synapse Credential User in the Synapse Portal (see Synapse RBAC roles for further details about permissions).
Therefore, I create following variables in my flow:
Tenant ID
Client ID
Audience for Azure Synapse (can be found in the documentation here)
Azure Synapse Development Endpoint
Synapse Pipeline Name (this is the name of the Pipeline, in my case PBI Guy Trigger Python)
I also specify an action to get the secret of my Service Principal from Azure Key Vault as I have stored my secret there. Otherwise you can also just store it in a variable but this is not the recommended way.
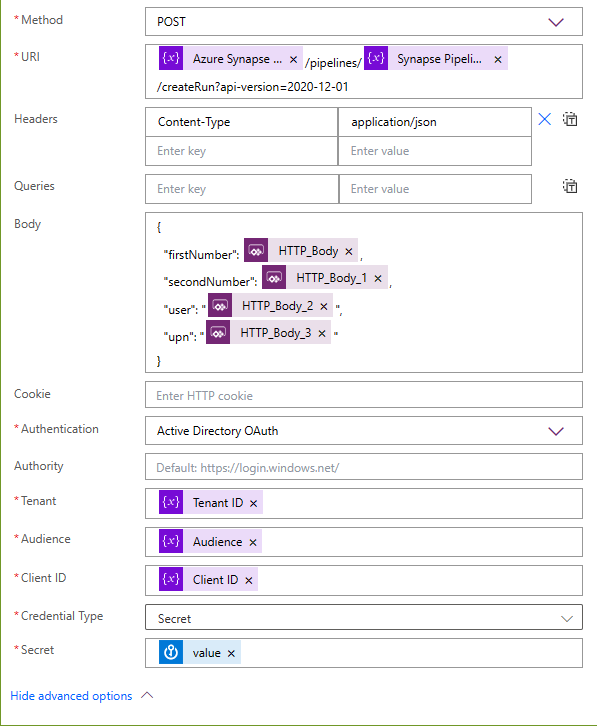
As a next step I add a HTTP request which looks like following:
I choose POST as Method, put in the REST API URI but replace the hardcoded parameters with my variables from the previous steps. In the body I specify my Pipeline Parameters. To get them from Power Apps, I place my cursor to the right position and select from Dynamic content “Ask in PowerApps”. This will create automatically the necessary dynamic content. As Authentication I choose Active Directory OAuth and provide the necessary variables.
This is already enough to trigger our Synapse Pipeline. Now, we just have to provide the input from Power Apps input fields to the Power Automate flow. So let’s save our flow, select the button, and on the OnSelect property specify what should happen. We can reference to the flow by name and select Run as attribute. In the brackets we can now add values to the variables we specified in the body of our HTTP action in the flow. To do so just reference to the input object and add Text as attribute. On top I’m using the out of the box User object to provide the full name and email. In my case the code looks like following.
Now let’s test it by running the app, provide some numbers and hit the button. If everything is set up correctly, the flow as well as the Synapse Pipeline will run successfully. In my case it took roughly 1 minute and I can see the result in my ADLS Gen2. This is great! As everything works I save and publish my app.
To make the app more user friendly, I modified the flow further to call the REST API to get a current status of the Synapse Pipeline. I do a loop until the Pipeline gives a Succeeded message which I give back as response to the Power Apps app. On top I’m using a loading gif while the whole flow is running. Once finished, the gif will disappear and I trigger a Dataset refresh making sure the latest data will be loaded.
Note that your Service Principal needs additional permission to be able to read the status through the REST API, for example the Synapse Monitoring Operator.
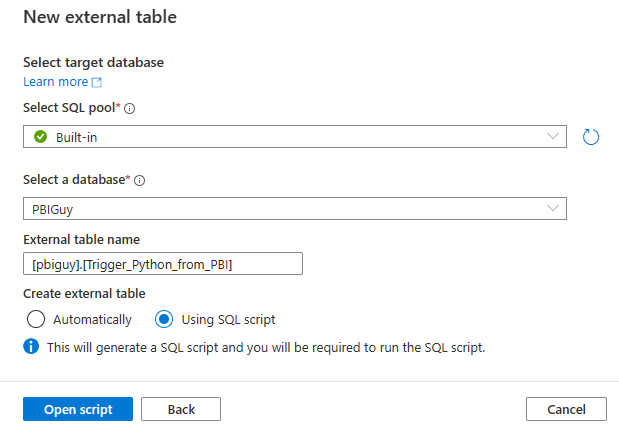
One of my last steps is now to connect the dots with Power BI. Through SQL Serverless Pool I can read parquet files with the OPENROWSET statement, but this is not supported with Power BI. As we need a way through DirectQuery to access the files, I create an External Table in my SQL Serverless Pool by just going to my file, right click on it, select New SQL script, and choose Create external table.
In the pane on the right hand side I select to continue. Afterwards I configure in which SQL Pool as well as which database my external table should be created, give it a name, and choose “Using SQL script” to get the full control of the script.
As I haven’t created the pbiguy schema yet, I just add a line of code to do so. Further, I modify the location to not point to a single file but rather to the overlaying folder by adding two * at the end.
If everything worked as expected you will get a table with all scenarios for all users so far.
Now we can connect with Power BI through the SQL Serverless Endpoint. This one can be found in the Azure Portal in the overview of our Synapse workspace.
Back in Power BI Desktop I select Azure Synapse Analytics SQL, configure the connection, choose DirectQuery, and paste a SQL Statement to select all columns and rows. Once done, I create a simple table visual right to the Power Apps visual. This way we can make sure the scenario will be visible once the whole process has finished. Now let’s do a final test and provide some data and calculate our scenario. Once I add some numbers and hit the button, I have to wait till my process has finished. In my version I added a rocket as gif to indicate the process is running (see comment above).
Once done, I see immediately the result in my table!
That’s it, it works! This way multiple users can access the same report, calculate their scenarios and through filter options (or even with RLS) you can make sure that each user can select his or her scenario.
Some last thoughts
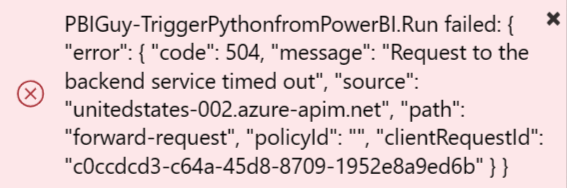
As much as I love the whole solution there are still some things to consider. As written above, the main idea was to prove that from Power BI you can trigger a Python (or R) script and get the result back in near-real time. With Azure Synapse you have unlimited scalability. On the other hand it takes quite long to process the whole request and the bottle neck is the Synapse Pipeline. If you, like me, add a “Respond to a Power Apps” action at the end of your Power Automate flow, it could be that you get an error in the app if the flow runs longer than 120 seconds (this is the timeout limit of the action) like the one below.
Especially if you run it for the first time, Synapse Pipeline will take longer as it has to spin up. Therefore I would suggest to try Azure Functions as I’m expecting a much faster process time.
Further and as well mentioned at the beginning, instead of storing individual and multiple small parquet files, I would rather store it directly into an Azure SQL DB.
Please let me know if this post was helpful and give me some feedback. Also feel free to contact me if you have any questions.
From time to time I got asked how customers can export Paginated (or Power BI) Reports automatically to store them e.g. in OneDrive or any other location. One way is obviously to do it manually, but we’re looking for an automatic way. So why not use the out-of-the-box Subscribe button within Power BI Service? Because it will send you an email and you can’t decide to store it somewhere else. Luckily, Power BI offers an API to achieve what we’re looking for. But what if I’m not a developer and don’t know how to write code e.g. in PowerShell or Python? No worries, Microsoft got you covered with Power Automate!
Prerequisites
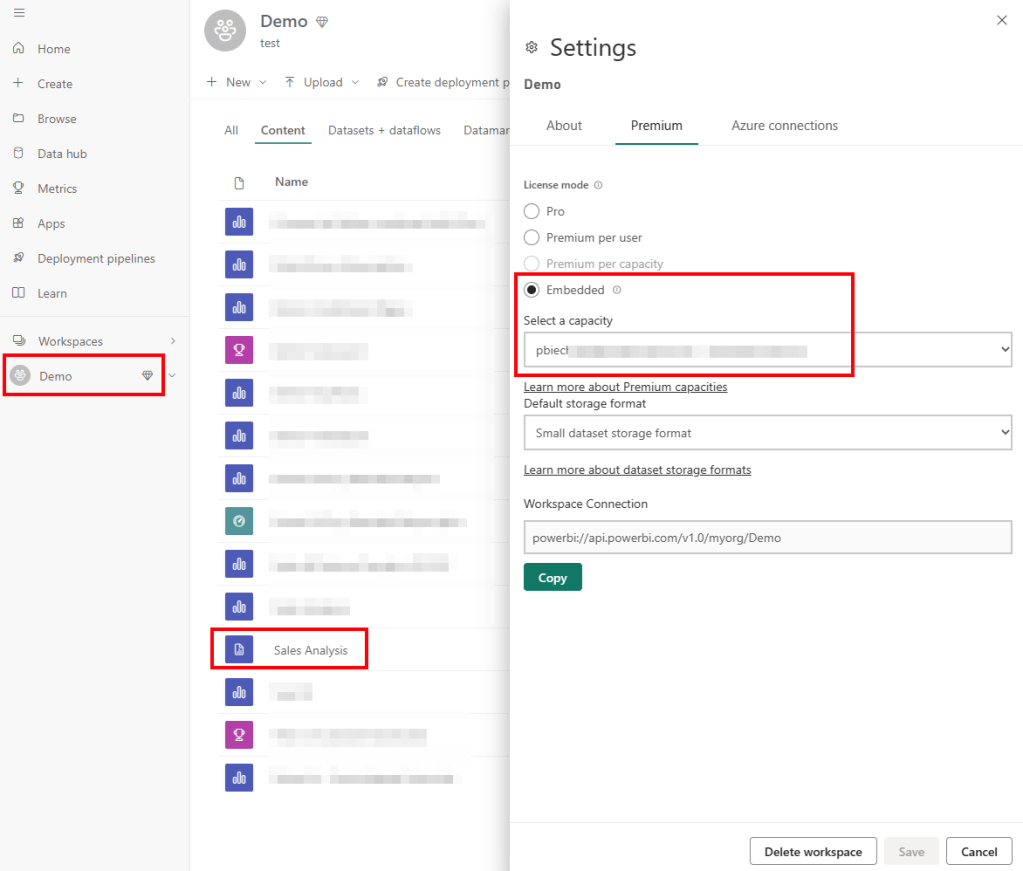
There are a few things which are needed to be able to follow this approach. First of all, Paginated Reports are part of a Power BI Pro license BUT if you wish to export a Paginated Report automatically, you still need a capacity (Premium or Embedded) to be able to do so. Reason is to make sure the end user is licensed in a proper way because through Premium the end user requires only a Free license. If you try to export a Paginated Report through the API backed up with a Pro license, you’ll get an error as you can’t make sure the end user also have a Pro license. That’s the reason why a capacity is needed. But buying Power BI Premium just to be able to export PDFs automatically is probably an overhead. Therefore we’re looking for a more cost-effective way which can be achieved with Power BI Embedded. Why? Because Power BI Embedded can be paused and it will not generate any cost at all! So we can turn it on just when needed, export our PDFs, and shut it down afterwards! Keep in mind while Embedded is paused the Reports in the associated workspaces will not be accessible.
So here’s a list of what we need:
Power BI Pro license
Power BI Embedded
Power Automate license
Service Principal with sufficient permission
Basic understanding of REST API
Basic know-how of DAX
Because we’re going to call the REST API to start and pause our Power BI Embedded capacity with Power Automate, the HTTP connector is needed which is Premium (as of February 2023). Therefore the O365 included licenses is not enough as “only” Standard Connectors are included.
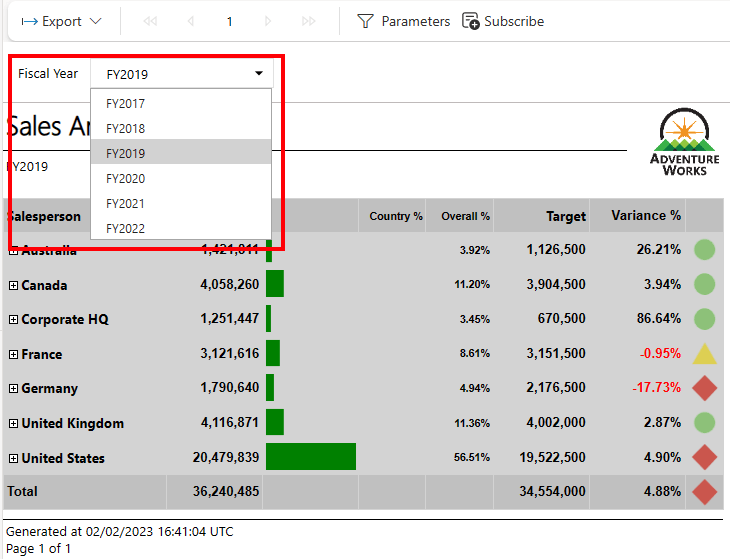
For my example I’m going to reuse the Sales Analysis Paginated Report from the Paginated Report in a Day course. I want to create one PDF for each Fiscal Year automatically and save each PDF into OneDrive.
Further, I prepared a folder in OneDrive called “Demo” where I wish to save my PDFs.
Let’s get started with Power Automate
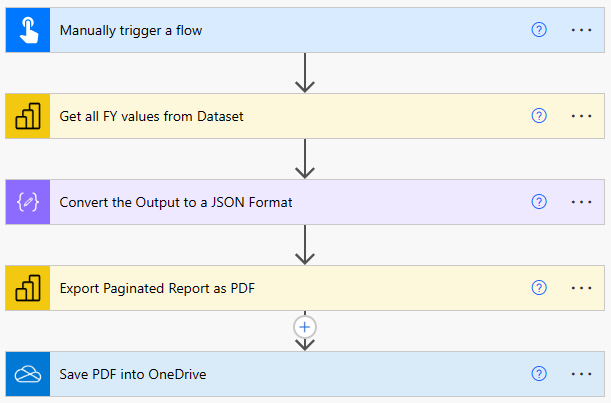
Once I logged in into Power Automate via https://flow.microsoft.com/en-us I select “+ Create” on the left hand side and select “Instant cloud flow”. This means I can trigger my flow manually which is handy during development. Once done, I can change the trigger to e.g. a schedule like every Monday morning at 7am. After the new window pop up, I name my Flow as wished (PBI Guy – Save PDF from Paginated Reports), select “Manually trigger a flow”, and hit the Create button.
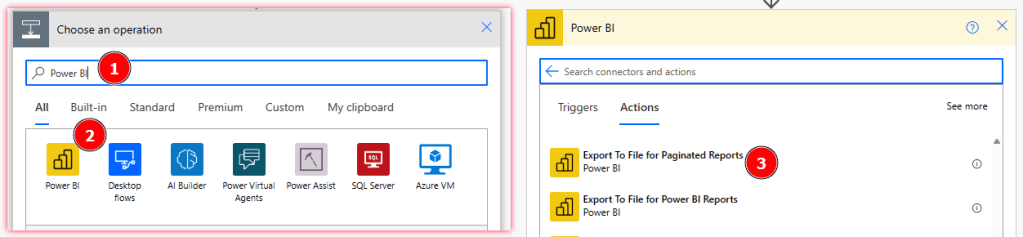
Let’s first test if I can save a PDF export into OneDrive and focus on starting & pausing the Capacity in a next step. So our first step is to get the PDF and then save it into OneDrive. To create a new action, just select the + New Step. Now, search for Power BI and select the build-in Power BI Connector. Once selected, scroll and search for “Export To File for Paginated Reports”.
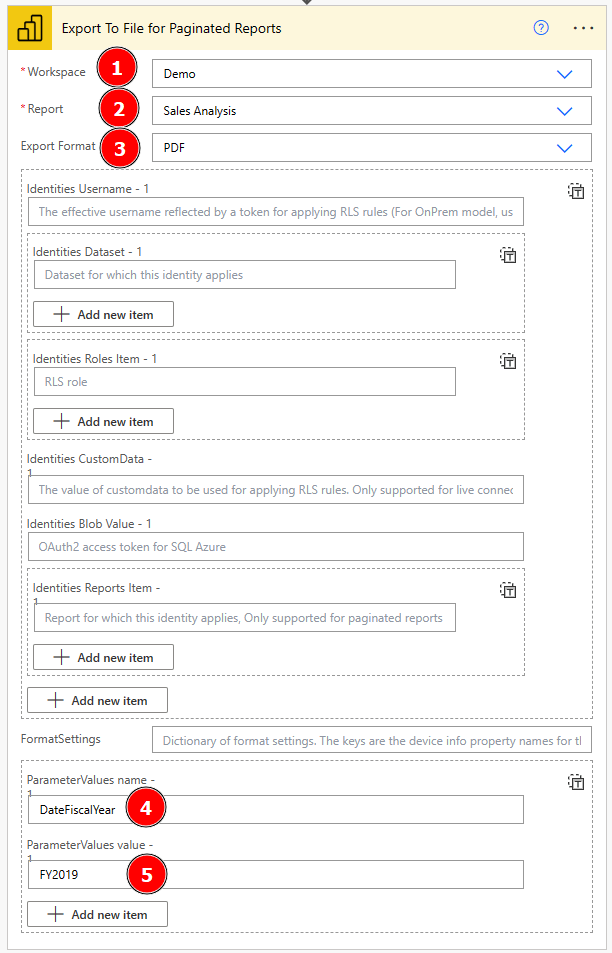
Afterwards, we have to configure our action by selecting our Workspace, Report, wished Export Format, and specify our Parameter which is Fiscal Year in this case. Be cautious by naming the Parameter as you need the internal name, not the label of the Parameter. Therefore you have to open the Paginated Report with Report Builder and check the internal Parameter name.
In my case it’s called “DateFiscalYear”.
Now that I have all needed details I switch back to my Flow and configure the action by selecting the Workspace (Demo), afterwards a list of my Paginated Reports will appear where I select the Sales Analysis, and choose my wished Export Format. Per default it’s PDF but you can also choose another option if you wish. Next, I provide the Parameter name and add a Value (FY2019) for testing purpose.
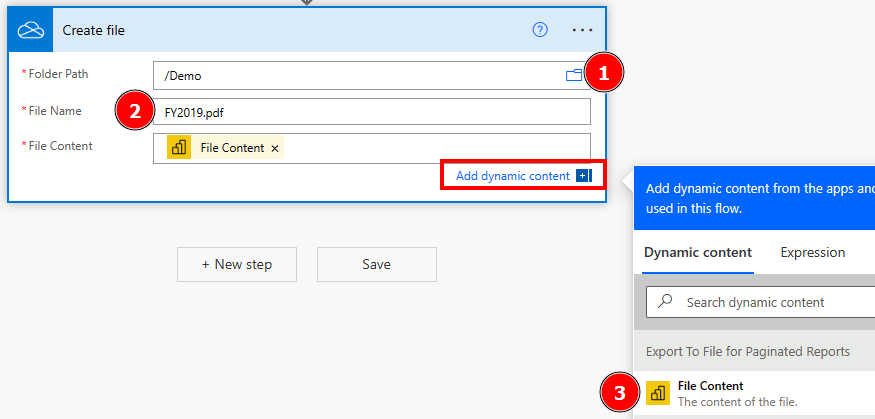
Next, I add a New Step by hitting the button, search for OneDrive, select OneDrive for Business, and select “Create File” as new action.
Afterwards, I just configure the Path by selecting the small folder icon and browse to my wished destination. I add FY2019.pdf as file name and choose the File Content from the dynamic content pane as File Content for my action. If you somehow don’t see the dynamic content, just hit the button at the bottom right to expand it.
Let’s test the flow and see if a PDF will be saved into OneDrive. To do so just click at the top right on the Test button. A new pane will appear, just select Manually and hit Save & Test.
Running it the first time I need to sign in to the different connectors I’m using (Power BI and OneDrive). Just Continue to do so and hit as last step Run Flow. Keep in mind that the Power BI Embedded capacity has to run otherwise you’ll get an error as the Report is not available.
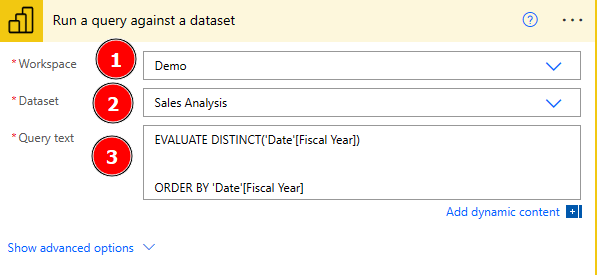
After approx. 1 Minute our Flow will finish and checking OneDrive I can see a new PDF has been created. Great! Opening it shows me that even the Parameter FY2019 has been passed and I see only FY2019 data – awesome! But now let’s parametrize it a little so my Flow will create a PDF for each FY available and not only FY2019. To do so I switch to Edit mode by selecting the appropriate button at the top right and add a new step right after our manual trigger by clicking on the + sign. I again search for Power BI and choose “Run a query against a dataset” as action. In here I select again my Demo workspace and Sales Analysis Dataset. The idea is now to run a DAX statement against the Sales Analysis Dataset to get all FY values which we will reuse to generate our PDF and save it. I quickly open DAX Studio, connect to my Dataset, and generate an EVALUATE DAX statement to get all FY values of my date table.
EVALUATE DISTINCT('Date'[Fiscal Year])

ORDER BY 'Date'[Fiscal Year]
I copy and paste the whole DAX statement into the query text of the action in my flow.
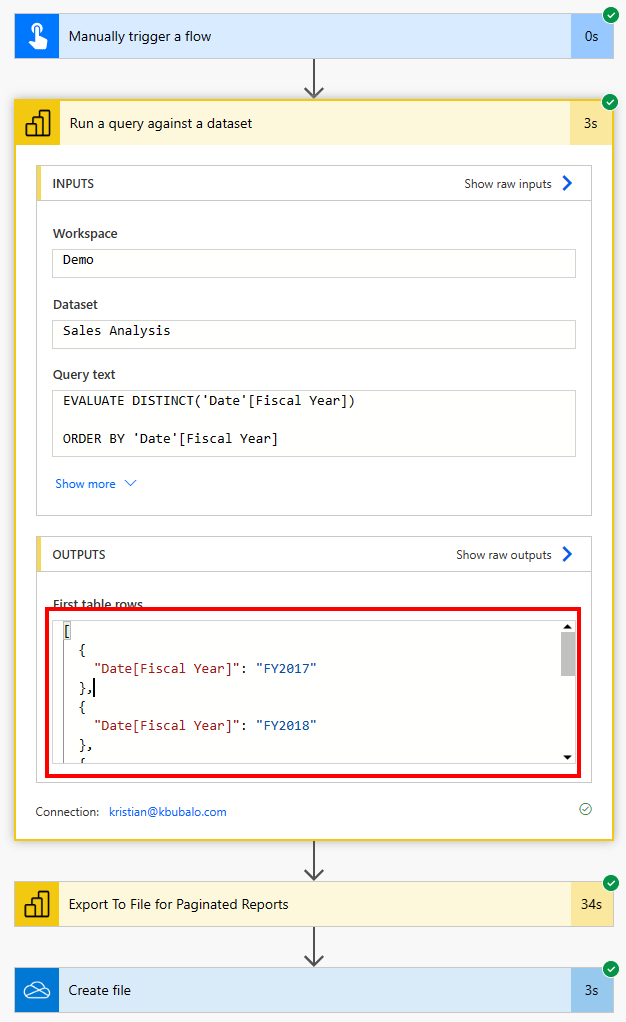
Again, to test if it works, I rerun the Flow and check the Output of my new action. As I can see there are different FY values as expected – perfect! I copy the whole output as we will need it for our next step.
I switch back to Edit mode and add a new step between the two Power BI actions. I search for JSON and select the Parse JSON action. Next, I add into the Content field the “First table rows” dynamic content from my previous step. Lastly, I hit the Generate from sample button and paste the result I copied a few seconds ago. This will automatically create a schema.
This step is needed to be able to get each value and reuse it afterwards to create for each FY a PDF. Before I move to my next step, I want to rename my Actions making sure by just reading them each user can understand what is happening. To do so, just select the three dots for each step and rename it accordingly. In my case I renamed the steps as following.
Now, let’s parametrize our Export to reuse the FY values dynamically. To do so, I select the Export action, scroll down to ParameterValues value section, delete my hard coded FY2019 and add Date[Fiscal Year] as dynamic content from my previous step. This will automatically create a “Apply to each” around my step.
Next, I drag and drop the “Save PDF into OneDrive” action into the Apply to each container and position it below the Export action. Lastly, I delete the hardcoded file name and again add the Date[Fiscal Year] dynamic content and add .pdf at the end. Otherwise it will not be saved as such.
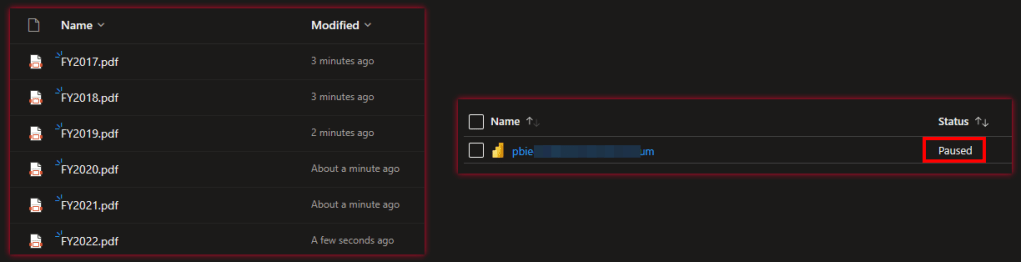
Again, let’s test our flow and check the result. After roughly 4 minutes our flow has finished and I see 6 different PDFs in my OneDrive, one for each FY – awesome!
Now we have to make sure to pause the Power BI Embedded Capacity once the job is done. Also, we want to make sure it starts once the flow has started otherwise the PDFs can’t be generated. Let’s first focus on starting the capacity.
The official Microsoft Documentation shows the necessary REST API call to start resp. resume the capacity. There are different parameters which are needed:
So let’s create these three parameters in our Flow to make it easier to use and reuse them. After switching back to my Flow I add a new action right after the trigger to create the parameters as a first step. I search for Variable and select “Initialize Variable”. I name the first variable “Subscription ID”, make it a String type and enter my Subscription ID as Value. If you don’t know the Subscription ID, just check it in your Azure Portal by selecting the Embedded Capacity.
I rename my action from Initialize variable to Define Subscription ID Variable and redo the steps for Resource Group Name and Dedicated Capacity Name Variables.
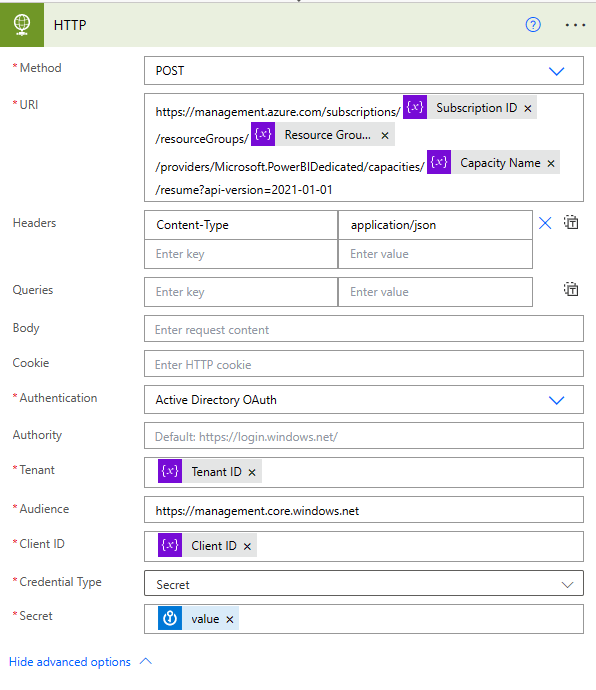
Now, let’s try to call the REST API with the HTTP action. Again, just hitting the + Button after my variables and search for HTTP. Once selected, I can configure it. The Method we have to use is POST based on the documentation. In the URI field I copy and paste the whole REST API call. Once copied, I delete the general parameter from the URL (everything between and including the {}) and replace it with the previously created variables from the dynamic content pane. In the Headers section, I add Content-Type as key and application/json as value. Because the REST API is not publicly available we have to log in somehow to be able to call it. Therefore, we can expand the advanced options and choose our authentication method. As I work mostly with Service Principals, I select Active Directory OAuth. Once selected, there are a few more things to fill out.
Let’s see how we can get the needed details. The Client ID as well as the Tenant ID can be found in the overview of the Service Principal.
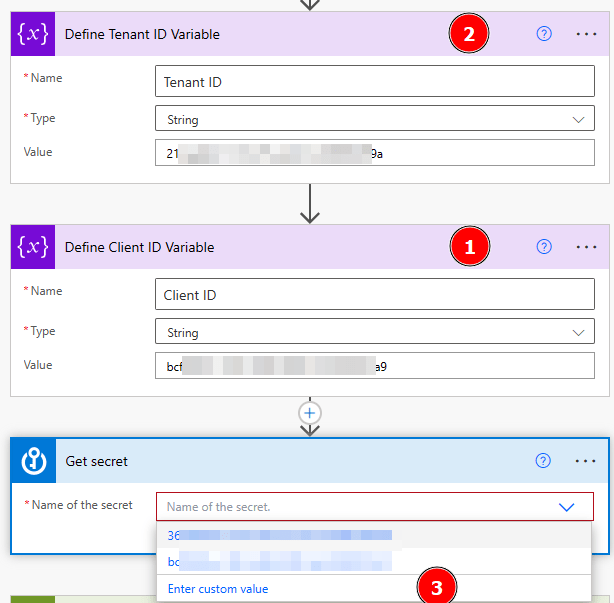
The Secret can be generated from the Service Principal or, like in my case, I have it stored in Azure Key Vault so I add a new step before the HTTP Call to get the secret out of it. To do so, again, I hit the + button, search for Azure Key Vault, and select Get Secret. In there, I can select the different Service Principals I have access to but because I have to provide the Client ID in the HTTP request as well, let’s parametrize it and create a variable one step before called Client ID. Further, let’s add a variable for the Tenant ID as well. Once done, I can now use the variable within my Get Secret action by selecting Enter custom value and select the Client ID variable.
Further, I can now add the variables to the associated places in my HTTP action and use the value of my Secret action. Lastly, Audience have to be added which is in this case https://management.core.windows.net.
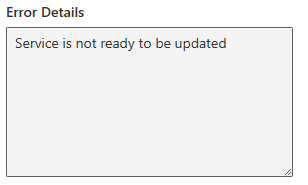
Let’s try and run our Flow to test it. If everything is set up correctly, you’ll get an error because the Power BI Embedded capacity is already running and you can’t start it again. Therefore following error will appear:
This means we need to check the status and, if it is paused, call the API, otherwise skip this part. And how can we check the status? Through REST API! Power BI offers an admin call to get all capacities (see https://learn.microsoft.com/en-us/rest/api/power-bi/admin/get-capacities-as-admin) We’re going to call it and check the status. So let’s create another HTTP request above the current one. This time, according to the documentation, we use a GET method and paste https://api.powerbi.com/v1.0/myorg/admin/capacities into the URI field. As headers we use again Content-Type as key and application/json as value. To be able to authenticate I’m going to use again my Service Principal and luckily, I have everything stored in variables so I can just put them into the right place. Only the audience will change this time as we’re connecting to Power BI now, not to Azure, therefore I have to use https://analysis.windows.net/powerbi/api for it.
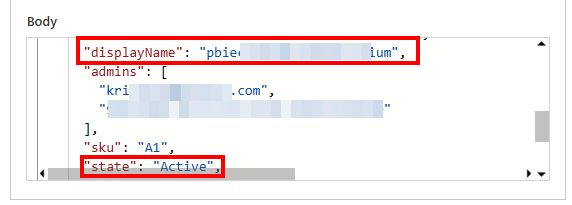
If I run the Flow now, it will still fail at the second HTTP action, but I get the result of the Power BI REST API and can check what the status is of my Embedded Capacity.
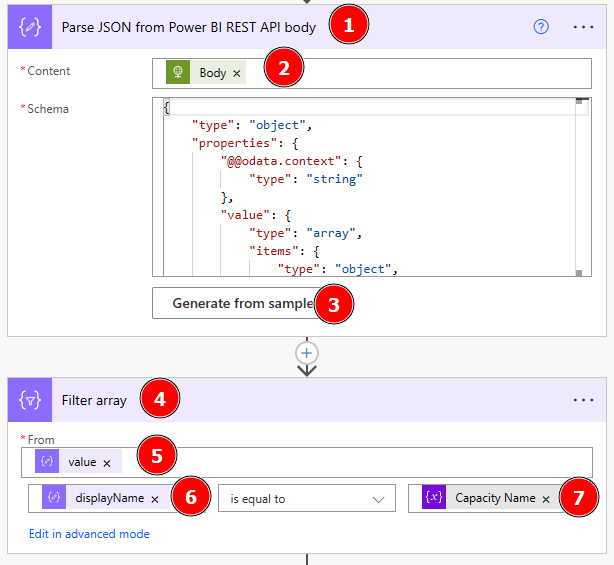
As a next step, I want to filter the result to only my capacity and extract the status. To be able to do so, I have to parse the body again to JSON and filter it afterwards. So, I copy again the whole body from the HTTP request and switch back to Edit mode. Once there, I add a new step after the Power BI REST API call and search for JSON and select Parse JSON. As content, I add the Body and generate the schema from a sample again by pasting it into the window after I hit the Generate from sample button. Now we have generated an Array which can be filtered. Therefore as next step I search again for Filter Array and select it. I put value from my previous step into From, select displayName as value on which I wish to filter and say it should be equal to my variable Capacity Name.
Now, that we filtered our result down to our desired capacity, we can do a check on the status. Let’s add a new step and search for Condition. In there, I add state from my previous step and configure is equal to “Active”. Once state is added as dynamic content, an Apply to each container will be automatically created. Just leave it as it is.
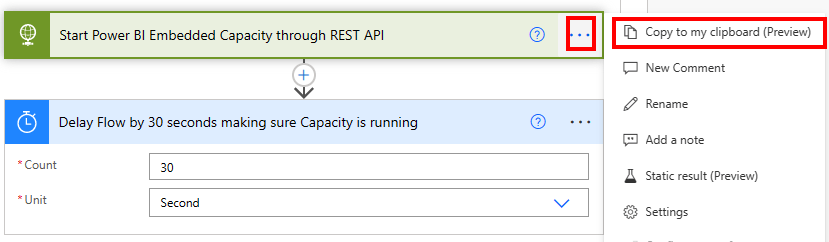
As next step, I drag and drop the HTTP request to start my capacity into the “If no” stream. This means, if the status is active, I don’t have to call the API to start it but if it’s not active, I would like to start it via REST API. As Power Automate will not wait until the Capacity is running and just continue to the next step, I want to make sure the capacity is in the desired state by adding a delay action of 30 seconds. Obviously, I could create a loop calling the Power BI REST API checking the status and, once changed to active, to proceed, but I’m not interested in the most performant way to execute this Flow but rather in an efficient, low-code way. Therefore the easiest method is to just add a delay.
Let’s one more time test our Flow making sure it’s working as expected. You’ll see, because the capacity is still running, it will go the “If yes” path and not call the REST API this time to start it. Therefore no error occurred and the PDFs have been generated again – great! And as you see the PDFs have been overwritten as we’re using the same name. This is expected behavior.
As a last thing we have to make sure now that our capacity will pause once the Flow is done. Again, checking the documentation there is almost the identical REST API call to pause resp. suspend the capacity. All we need to do is change “Resume” to “Suspend”. To be as sufficient as possible, let’s go to our Start Power BI Embedded action, hit the three dots, and choose Copy to my clipboard.
Now, I hit the + New step at the bottom of my flow, switch to My clipboard and select the copied action.
All I have to do now is to rename it and adjust the URI. What a time saver!
That’s it! Let’s test our final Flow by running it again. After roughly 4-5 minutes the Flow is done and I see on one hand that new PDFs have been created in my OneDrive and on the other hand my Power BI Embedded Capacity is now paused.
Let’s run it again making sure if the capacity is paused that the Flow will start it, still create the PDFs, and then shut it down. And again, after like 5 minutes it was successful. Checking the condition action in the Flow, we see the expression was false (capacity status is not active) and it went the right path to start it – perfect! During the run you could also refresh the page in Azure Portal to check the status of your capacity and you’ll see how it changed from Paused to Active and back to Paused.
The really last thing now is to delete the manual trigger at the top and replace it with what’s needed. E.g. a Schedule to run it every Monday 7:00am like in this example. Obviously, you can also choose other triggers depending on your needs. Keep in mind that Power BI offers a Power Automate visual out-of-the-box which can be used to trigger our Flow as well – from insights to action!
Please let me know if this post was helpful and give me some feedback. Also feel free to contact me if you have any questions.