Note from PBI Guy: A few weeks ago I had the pleasure to meet Manel Omani, a colleague of mine, who presented a super interesting solution how she’s tracking Power BI Capacity overloaders via Power Automate and notify automatically the Dataset owner. I thought this has to be shared with the Power BI community and asked here to create a blog post about it. Luckily, she agreed and I’m happy to share the result here.
As a Power BI Capacity administrator, have you ever experienced multiple slowdowns and noticed that too late ? This is a very common issue that capacity administrators face when they track and monitor the usage of memory/CPU of the artifacts. Thankfully, in the capacity setting we still have the possibility to set notifications whenever the load reaches x%, or when it exceeds the available capacity. This notifications are helpful to detect the slowdowns early on, but do not really help to highlight which artifact is consuming more resources than the others. To get this information, you need to check it on “the Premium metrics app”.
The idea of this article is to propose ways to combine the Premium metrics app and Power Automate in order to set notification to the owner of the artifact causing slowdowns on the capacity so that they can work on optimizing their data model and prevent future slowdowns.
Overloaders detection on Power BI Premium: the approach
Capacity overload happens when one consumes more CPU in a 30sec interval than what the capacity allows. For instance, if you have a P1 capacity, you can consume 8 cores * 30 sec = 240 sec of CPU time. If you exceed 240 sec CPU time in a 30 sec interval, all the queries that follow with be delayed.
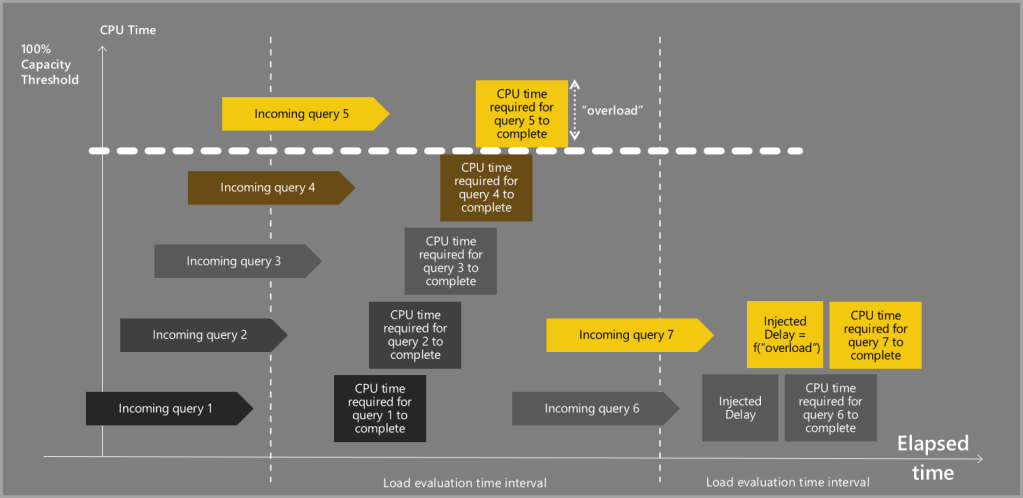
This overload can be detected on the Premium metrics app on the CPU% chart.

And from the Premium metrics app dataset we can run the following DAX query by using DAX Studio to get the list of overloaders IDs:
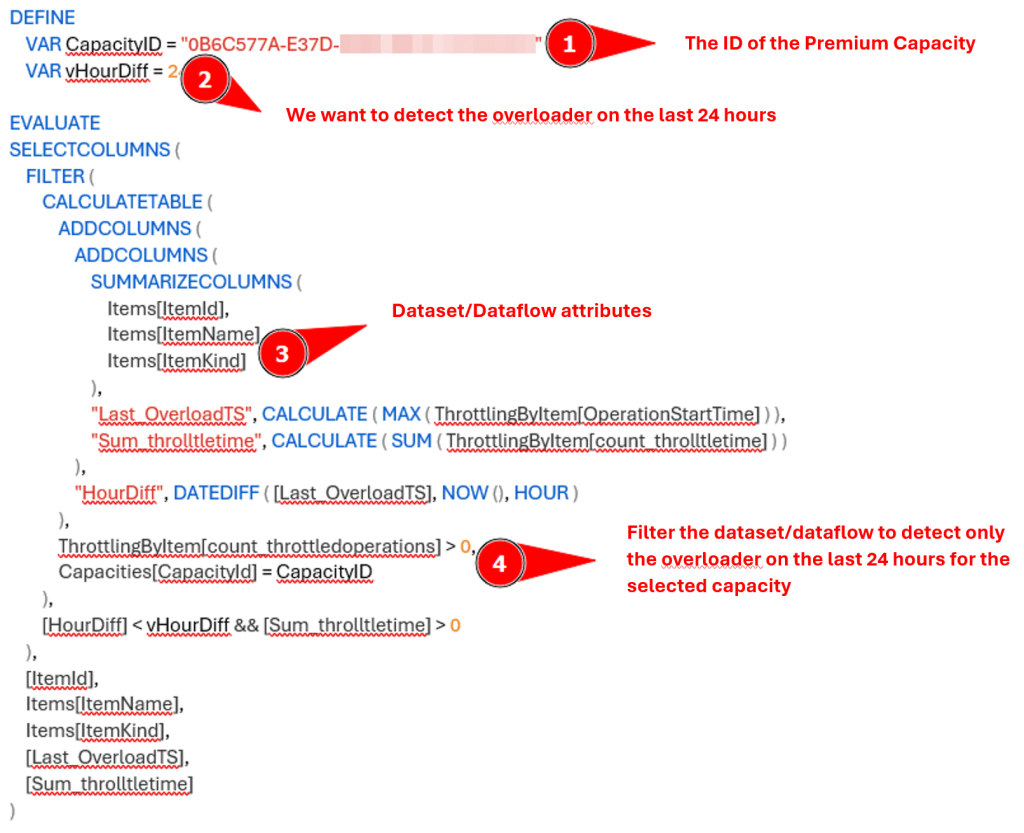
Keep in mind that your workspace have to be backed up by a capacity to be able to connect with DAX Studio to your Dataset and execute the statement.
This DAX query gives us the list of artifacts that has raised an overload in the last 24 hours. The results are as follows:

This DAX Query is run on the Data Model of the Premium App Monitoring. Please note that this DAX query may need to be changed if the data model of the App Monitoring is updated.
Now that the overloaders are identified, the objective is to get the owner of these artifacts and the details behind the overloading. As the Premium Capacity app does not hold this data, we need to find another approach to retrieve the owner of the dataset. One way is to use the Power BI Rest API: https://api.powerbi.com/v1.0/myorg/datasets/{datasetId} which can provide the email address of the user who configured the dataset.
Now, to get the details of the overload, such as “how many times the dataset has raised an overloading” or “how much CPU has been used”, we can run another DAX query over the Premium App monitoring dataset as follows:
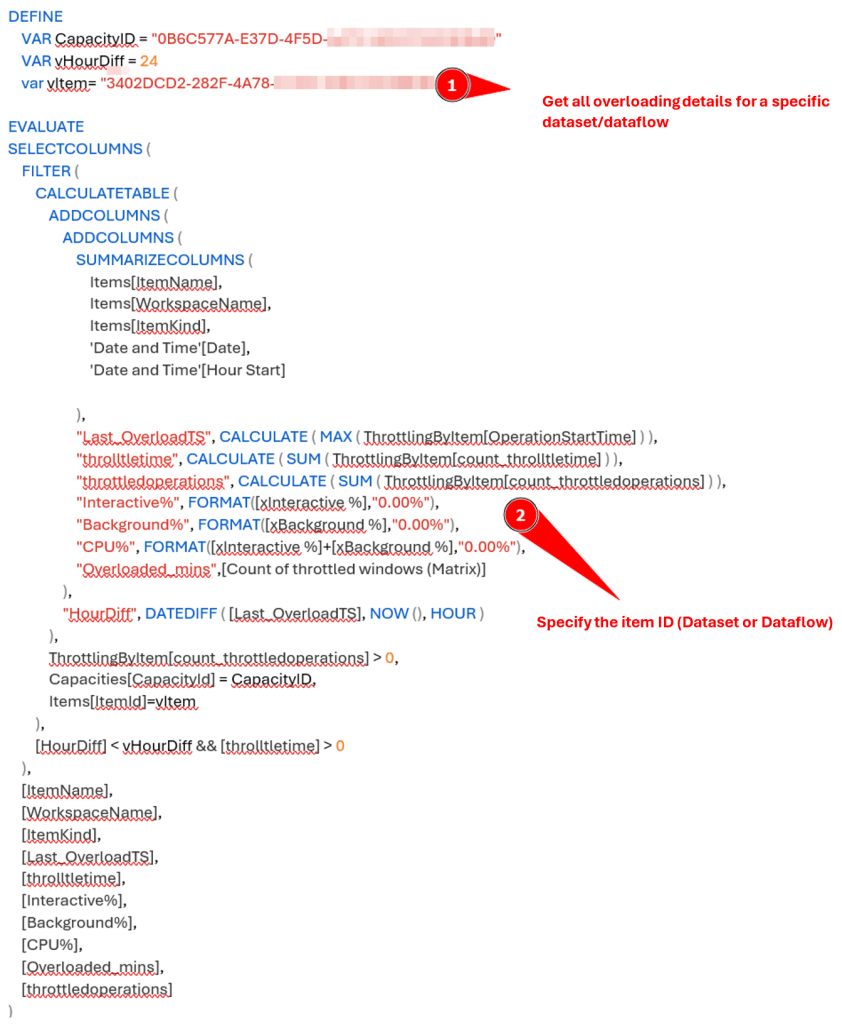
The results can be seen below:

With all these information, we can notify through email or a Teams message, the owner of the dataset (extracted from the Power BI rest API), with all the required information to handle the overload. It is also possible to save all these information periodically (in a Blob storage, DWH, CSV files, etc.), so that we can analyze the “bad students” of the Premium capacity and help them optimize their data model.
Overloaders detection on Power BI Premium: Setting the scene with Power Automate
For this example, we are going to use Power Automate to automate the e-mail/Teams notification to the owner of dataset who caused an overload in the last 24 hours with all the dataset consumption details.
Please note that Power Automate offers many ways to send notification or to store the data collected.
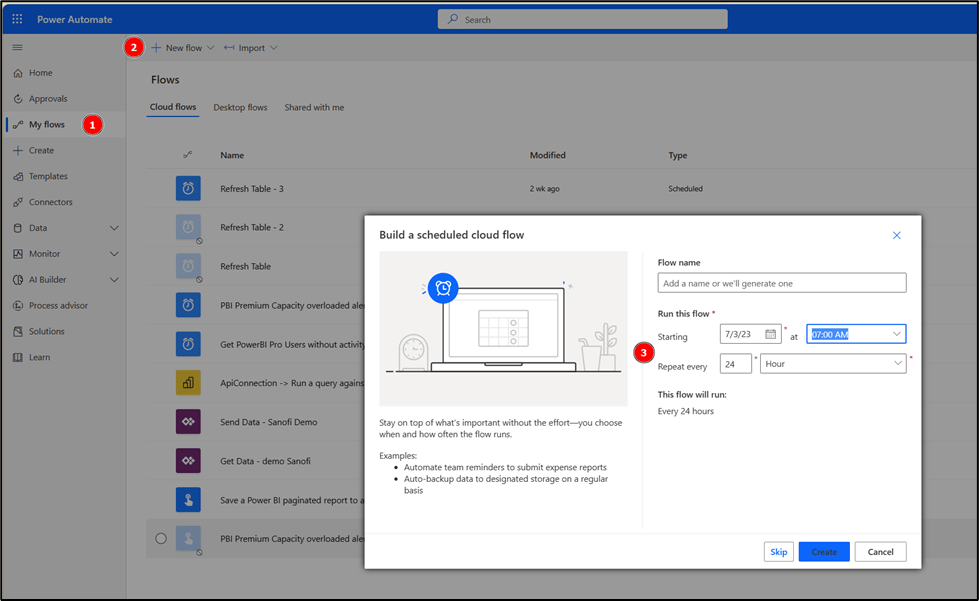
Once I logged into Power Automate, I will start by creating a flow with a scheduled Cloud Flow. The idea again is to run this flow each morning to see the overloaders of yesterday:
Let’s first create 3 variables that will help us later with our configuration:
- The first variable “CapacityName” will store the Premium Capacity ID
- The second variable “timeDiffrence inHours” will store how many hours I want to look at ( in my case, I’m using 24 hours)
- The third variable “Overloader details table” is an empty array that will be used to store the overloading details of each dataset so we can use it to send that to the owner.
After the creation of these variables, we will run our first DAX query in Power Automate by using the “Run a Query against a Dataset” Power BI action as follows:

Now that we have the IDs of the dataset that has caused an overloading in the last 24 hours, we will need to get their owner.
To get this information, I created a custom connector that will call a Power BI REST API : https://api.powerbi.com/v1.0/myorg/datasets/{datasetId}

You can find all the details of creating such connector on this article: Power BI – Custom Refresh with Power Automate
It’s not required to go through a Custom Connector. You could also use the HTTP Action but for reusability purpose it’s much easier with a custom connector.
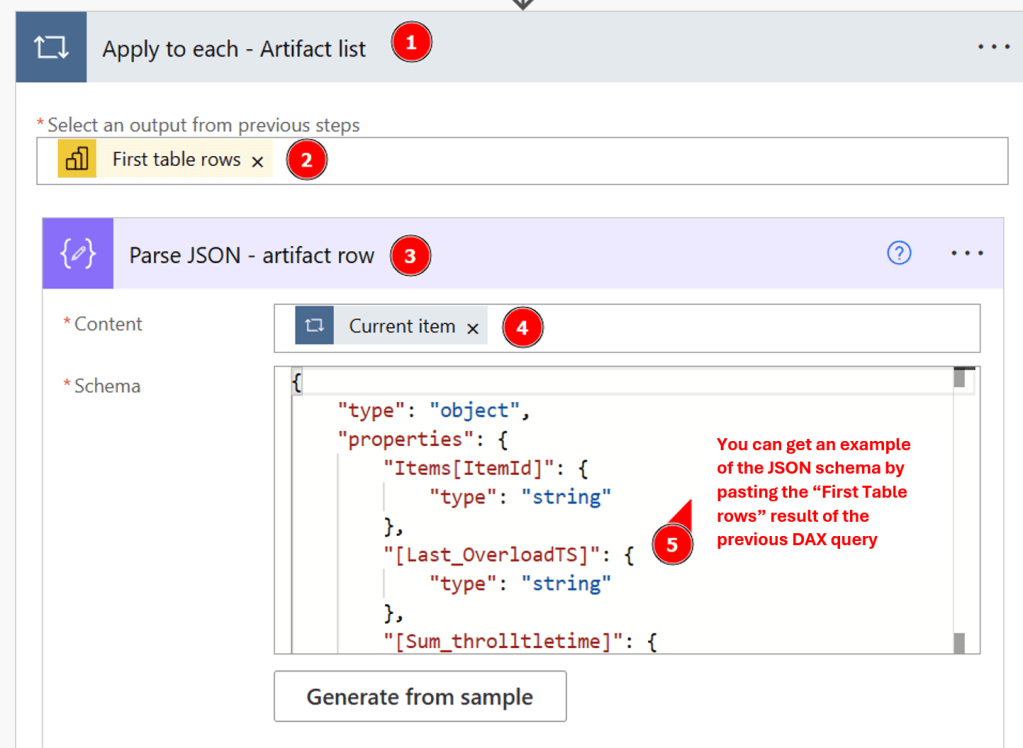
The “run a query against a dataset” action will return a JSON list that contains the IDs of the dataset. We will need to loop on each row in order to get their owner and run a second DAX query that will retrieve the overloading details. To do so, we will use “Apply to each” action in the flow and parse each “First Table rows” as follow:
After parsing the result of the DAX query, we will call the custom connector created earlier in order to get the owner of the dataset:

Now that we have the ID of the dataset parsed (Items[ItemID]) and the Owner of this dataset (ConfiguredBy), we can run our second DAX query to retrieve the details of overload of this dataset as follows:

Same thing here, we will need to parse the query result and use it to initiate our Table variable that will hold the throttling details for each dataset:

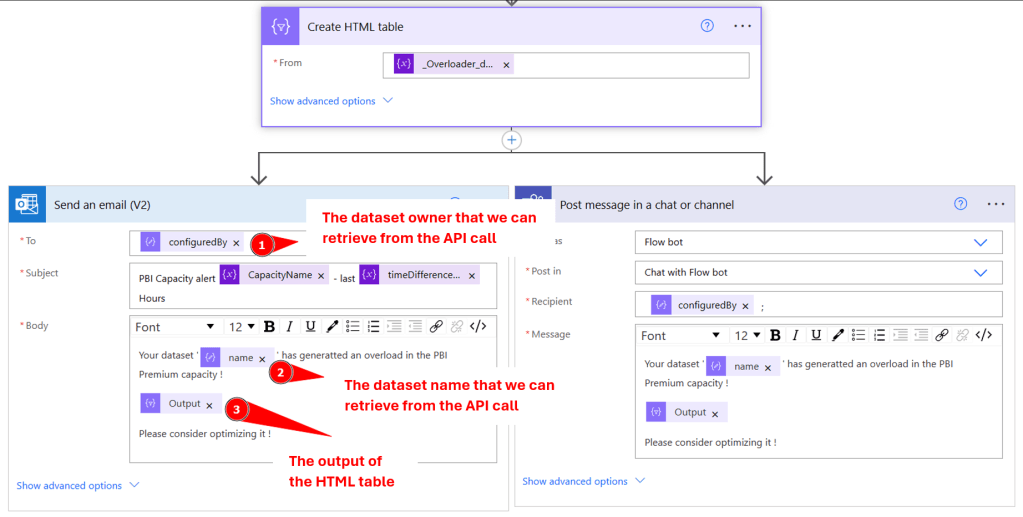
Now that we parsed our data and initiate a Table variable with the throttling detail (for only one dataset), we will create and HTML table that we can use in order to notify the dataset owner with the overloading that he created. Here you have the choice to either send and e-mail or Teams message, or even store the result in a SharePoint or Blob Storage:
The full flow is presented as follow:

For this, we just used some DAX statement to identify the overloaders and combined the information afterwards with a REST API call to retrieve the Dataset owner. Obviously, there are multiple ways to achieve the same goal but I hope I showed you in a low-code manner how to achieve this goal.
Please let me know if this post was helpful and give me some feedback. Also feel free to contact me if you have any questions.
If you’re interested in the files used in this blog check out my GitHub repo https://github.com/PBI-Guy/blog

Hello, Thanks for putting the action code.. its really interesting. i have followed the steps and able to construct the flow. while testing the flow its failing with the error\
{“error”:{“code”:”DatasetExecuteQueriesError”,”pbi.error”:{“code”:”DatasetExecuteQueriesError”,”parameters”:{},”details”:[{“code”:”DetailsMessage”,”detail”:{“type”:1,”value”:”Query (15, 58) Cannot find table ‘ThrottlingByItem’.”}},{“code”:”AnalysisServicesErrorCode”,”detail”:{“type”:1,”value”:”3241803779″}}]}}}
I have followed the linked url you have referred, and in that DEFINITION step Scope and Resources URL’s are bit confusing i have used exactly the same what was given in the post.
Resource URL: https://analysis.windows.net/powerbi/api
Scope: https://analysis.windows.net/powerbi/api/.default
could you please guide me with resolving the error…
LikeLike
Hi
For me it looks like the Table “ThrottlingByItem” can not be found in the Dataset, therefore you get the error. I’m not sure if it has changed meanwhile or if it’s just a typo. Make sure you’re really matching the name and the table is available. You can for example connect with DAX Studio to the Dataset and check it.
LikeLiked by 1 person
Yes that’s true, with recent changes from premium capacities to Fabric capacities the monitoring app changed, so the dataset we are browsing before was not valid anymore, and not loading the data needed. could you please update the query for Fabric capacity monitoring? it would be helpful and really appreciated.
i have designed something similar please take a look and suggest.
DEFINE
VAR CapacityID = “XXXXXXXXXXXX”
VAR vHourDiff = 0
EVALUATE
SELECTCOLUMNS (
FILTER (
CALCULATETABLE (
ADDCOLUMNS (
ADDCOLUMNS (
SUMMARIZECOLUMNS (
Items[ItemId]
),
// “Last_OverloadTS”, CALCULATE ( MAX ( ThrottlingByItem[OperationStartTime] ) ),
“Last_OverloadTS”, CALCULATE ( MAX ( MetricsByItemandOperationandHour[Date] ) ),
//”Sum_throlltletime”, CALCULATE ( SUM ( MetricsByItemandOperationandHour[Throttling (min)]) )
“Sum_throlltletime”, CALCULATE ( SUM ( MetricsByItemandOperationandHour[Throttling (min)]) )
),
“HourDiff”, DATEDIFF ( [Last_OverloadTS], NOW (), HOUR )
),
MetricsByItemandOperationandHour[Throttling (min)] > 0,
Capacities[CapacityId] = CapacityID
),
[HourDiff] 0
),
[ItemId],
[Last_OverloadTS],
[Sum_throlltletime]
)
LikeLike
Hi, Can you please let me know if you have DAX queries for the new version of Fabric Capacity Metrics App?
LikeLike
Hi
Not yet, is on my to do list 🙂
LikeLike
Hi, I’m looking forward to it 🙂
Thank you
LikeLike
this is great:) however, i cant seem to be able to add Items[ItemID] to my custom connector field “DatasetId”. It doesnt show as selectable from my Parse Json step.
LikeLike
Check out the Output once you run the flow to see what kind of fields you get. Eventually the name has changed or something similar.
LikeLike
Great article, but, as said above, it seems like it is no longer working due to the changes on the Fabric Capacity Metrics app.
Any chance you found the time to provide some updates? 🙂
LikeLike
Hi,
Unfortunately not yet, but looking at the roadmap (https://learn.microsoft.com/en-us/fabric/release-plan/admin-governance#fabric-monitoring) I’m sure there will be some further updates coming so stay tuned, eventually it will be solved OOTB 🙂
LikeLike
[…] Detect Capacity Overloaders and automatically contact them: Track Power BI Capacity overloaders with Power Automate – PBI Guy (pbi-guy.com) […]
LikeLike
any plans to upgrade the code with latest metrics data? as the dax is not working
LikeLike
Hi,
No plan to update it but you can check out FUAM in which a notebook is used to extract the Metrics App data, see https://github.com/microsoft/fabric-toolbox/tree/main/monitoring/fabric-unified-admin-monitoring
LikeLike