Use Dynamic M Parameters in DirectQuery mode and Paginated Reports

Recently, I got a very interesting challenge from a customer of mine. In their use case, they have created a Power BI Report (and Dataset) in DirectQuery mode. On top, they have created a Paginated Report on the same Dataset, and integrated the pixel-perfect report through the out-of-the-box Paginated Report visual. Lastly, to improve performance, they used Dynamic M Parameters in Power BI to influence the query send back to Power BI. If you’re not familiar with this approach, Microsoft has a great documentation here: https://learn.microsoft.com/en-us/power-bi/connect-data/desktop-dynamic-m-query-parameters Now, they wish to pass the selected filter from Power BI to the Paginated Report within the Visual but unfortunately it’s failing with an error message like “You have attempted to pass an invalid parameter”. Let me explore what exactly is happening and how to resolve the issue in this blog post.

Prerequisites

In this scenario we need quite a few things:

  • A database which is DQ supported. In my case I’m going to use an Azure SQL DB
  • Power BI Desktop
  • Power BI Report Builder
  • Power BI Service
  • Power BI Pro license
  • M / Power Query know how

Setting up the environment

As mentioned, I’m going to use an Azure SQL DB on which I have a an AdventureWork Database 2019. In there, I’m going to connect to the SalesLT.Product table in DirectQuery mode from Power BI.

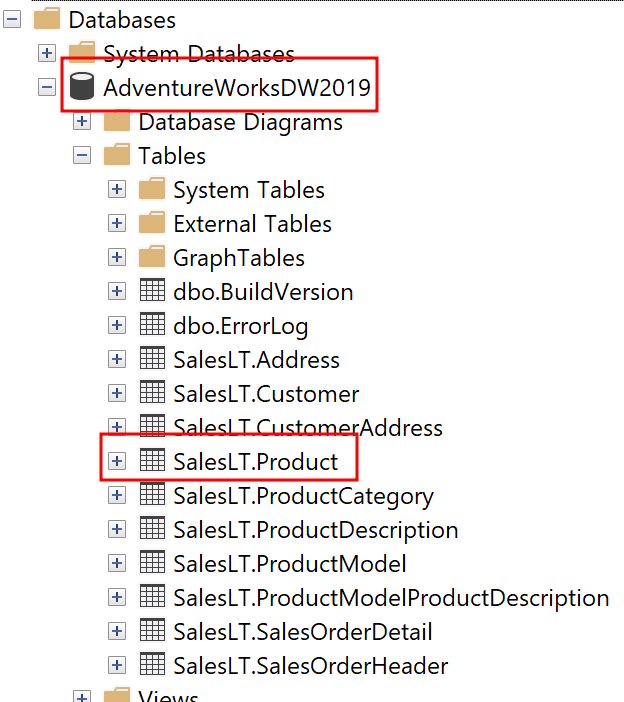
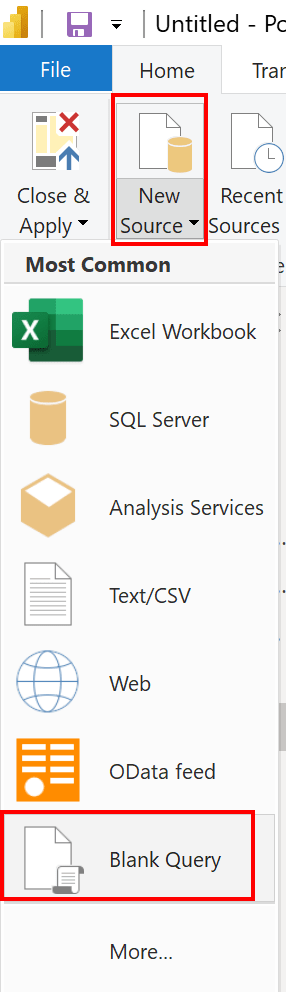
To do so, I select the Azure SQL Database Connector, pass my Server and Database name, choose DirectQuery, and past a simple SELECT statement in the Advanced Options.

SELECT p.[ProductID]
      ,p.[Name]
      ,p.[ProductNumber]
      ,p.[Color]
      ,p.[StandardCost]
      ,p.[ListPrice]
      ,p.[Size]
      ,p.[Weight]
      ,p.[ProductCategoryID]
      ,p.[ProductModelID]
      ,p.[SellStartDate]
      ,p.[SellEndDate]

FROM [SalesLT].[Product] p

Before loading my data, I hit the transform button to switch to Power Query. In there, I want to parametrize the Server and DB name. Further, for my test purpose, I want to use the dynamic M Parameter and pass the Product Number into my M. For that reason I create three Parameters in total using the CA-1098 value as current for my product number.

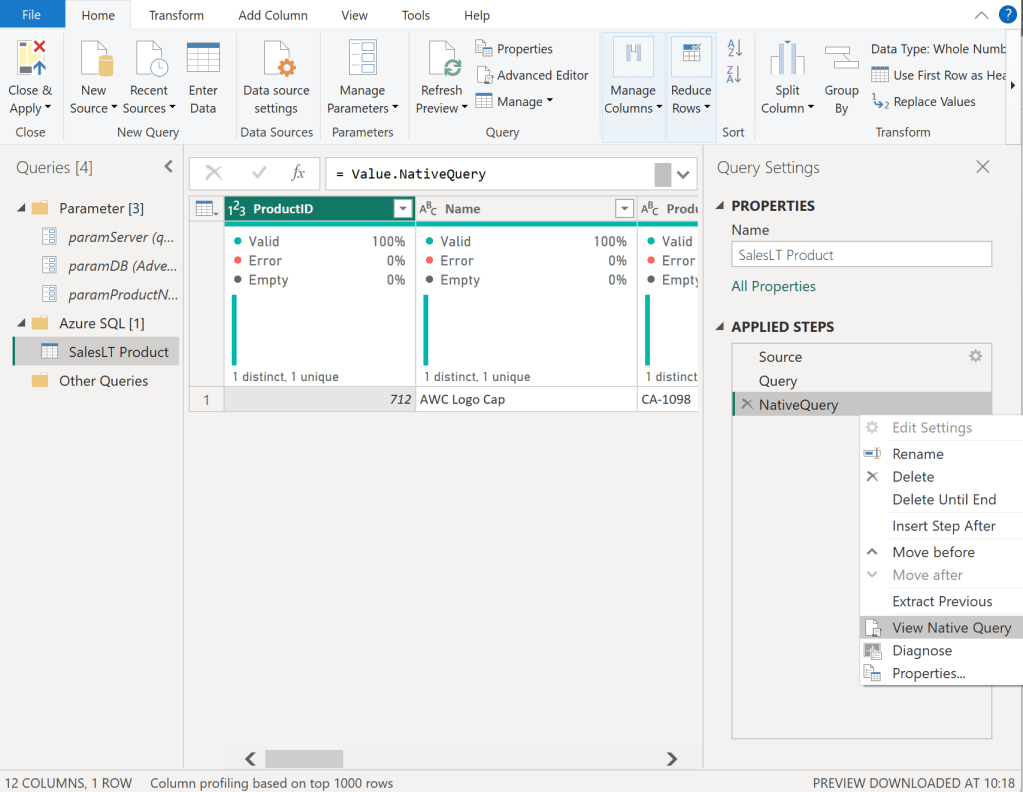
Once done, I select my Sales Table and right click on the “Source” step on the right hand side. In there, I can see that Native Query is greyed out and therefore not enforced. As we need Native Query folding, we have to customize our M a little bit. If you’re not familiar with Native Query folding, I can recommend the official Microsoft Documentation found here: https://learn.microsoft.com/en-us/power-query/native-query-folding

For some data sources the View Native Query is always greyed out as Power Query can’t identify if it is enabled or not. To make sure if Native Query Folding is enabled, trace your data source and see what query has been executed on it. Additionally, you can use Value.Metadata function in M to check if “IsFolded” is set to true or not.

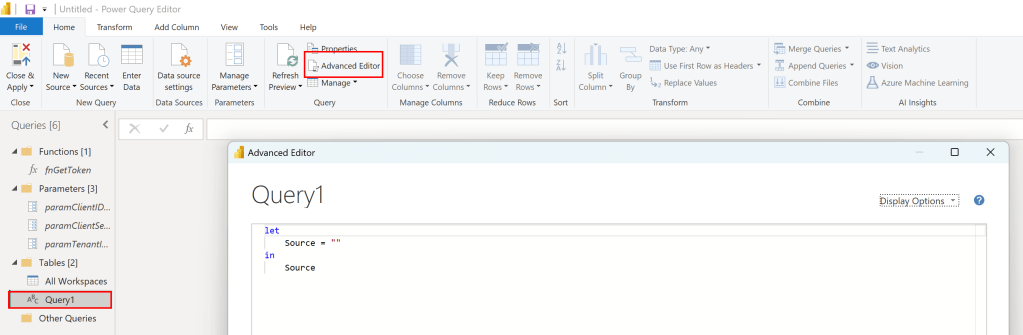
Now, I switch to the Advanced Editor of Power Query and customize my code to, on one hand, use the Server and DB parameters, and enforce Native Query folding on the other hand.

In the screen shot below, you can see how I use my two parameters in the Sql.Databasse function of my first Source step. Afterwards, I created a new step called Query and pasted my SQL statement in there. I want to raise your attention to the WHERE clause here in which I point to my Product Number parameter with the default value “CA-1098” right now. Lastly, I have a third step called NativeQuery in which I enforce the Native Query folding by passing the Source, Query, and enforce it by setting EnableFolding to true.

let
    Source = Sql.Database
            (
                paramServer,
                paramDB
            ),
    Query = "
            SELECT p.[ProductID]
                ,p.[Name]
                ,p.[ProductNumber]
                ,p.[Color]
                ,p.[StandardCost]
                ,p.[ListPrice]
                ,p.[Size]
                ,p.[Weight]
                ,p.[ProductCategoryID]
                ,p.[ProductModelID]
                ,p.[SellStartDate]
                ,p.[SellEndDate]

            FROM [SalesLT].[Product] p

            WHERE p.[ProductNumber] = '" & paramProductNumber & "'",
    NativeQuery = Value.NativeQuery
                    (
                        Source, 
                        Query, 
                        null, 
                        [EnableFolding = true]
                    )
in
    NativeQuery

Now, my table shows only one row for the CA-1098 Product Number an Native Query is enabled.

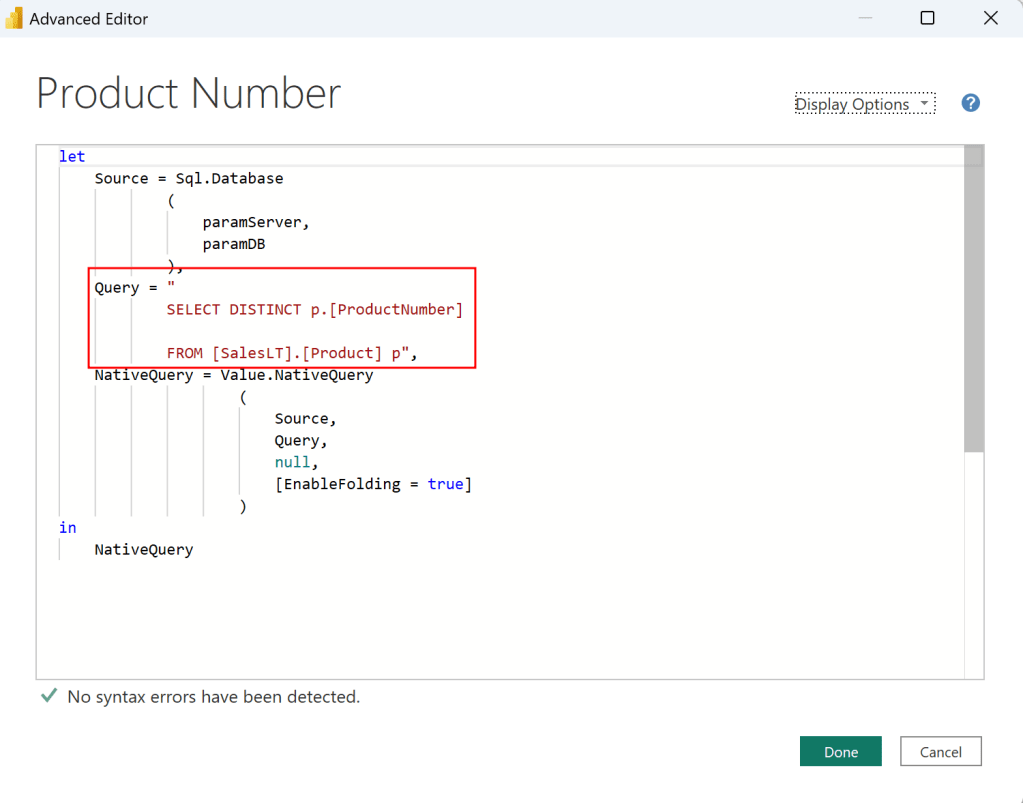
Before we close Power Query, I need an additional table to list all my Product Numbers. For that, I just duplicate the SalesLT Product table, rename it to Product Number, and adjust the SQL Statement to a SELECT DISTINCT.

let
    Source = Sql.Database
            (
                paramServer,
                paramDB
            ),
    Query = "
            SELECT DISTINCT p.[ProductNumber]

            FROM [SalesLT].[Product] p",
    NativeQuery = Value.NativeQuery
                    (
                        Source, 
                        Query, 
                        null, 
                        [EnableFolding = true]
                    )
in
    NativeQuery

Now I can hit the Close & Apply button. Once loaded, I switch to the Model view, select the ProductNumber column from the Product Number table, enhance the advanced options, and choose to bind this field to the paramProductNumber parameter. Pay attention that the two tables are not connected via a relationship in my model.

I hit continue on the potential security risk message that pops up next. Let’s test if it works by switching the view to Report View, add a slicer visual with the ProductNumber field from the Product Number table, and add a table visual with some columns from the SalesLT Product. After selecting a Product Number in our Slicer, we see the corresponding item in our table – it works!

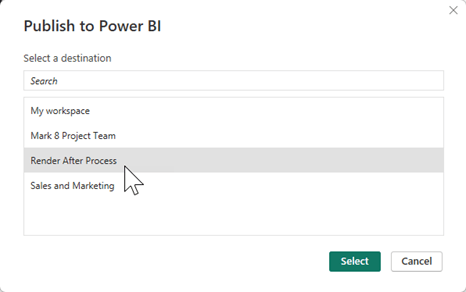
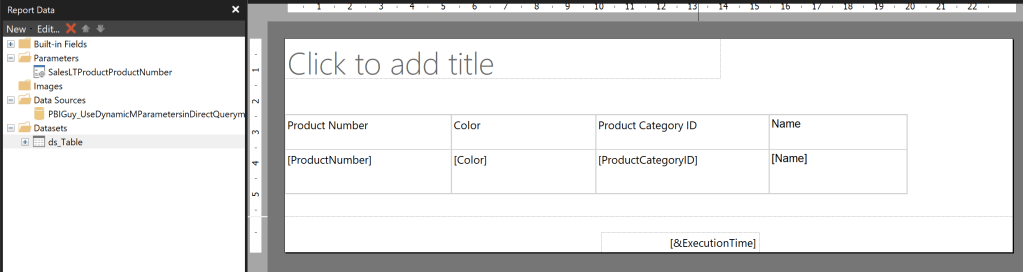
Next, I publish the Report and create a Paginated Report on top of the newly created Dataset. The report itself is pretty simple, including just one Table with four columns. The Data Source is my freshly created Power BI Dataset.

I created the Paginated Report Dataset through the Query Designer in following way and selected the Parameter Checkbox for ProductNumber.

Once the Dataset and Parameter have been created, I open the properties of the Parameter. In there, I make sure I don’t provide any default value as it’s not needed. Further, I make allow Multiple Values making sure I don’t have to change it later on as I wish to pass multiple Product Numbers in a later stage.

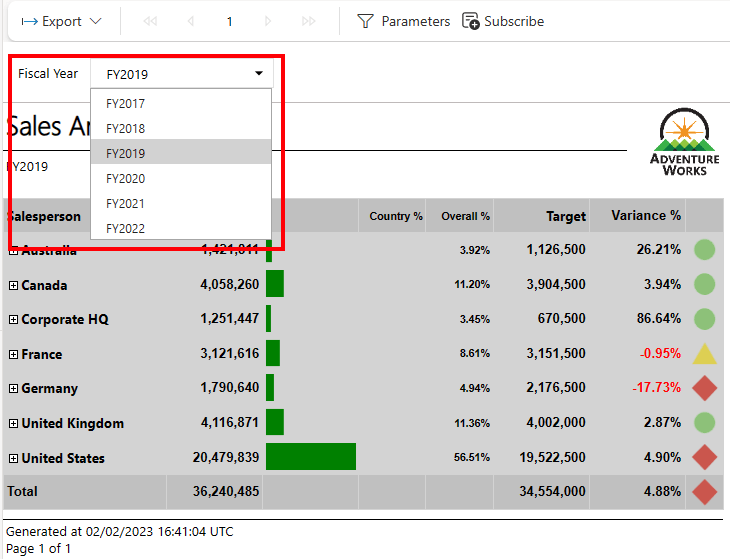
Now, when I run the Report and select CA-1098 it works and renders my table. But there is one big but right now. I only see one value in my drop down list.

The reason might not seen obvious at the first sight but it’s very reasonable at the end. Because I provided a default value in my Power BI Dataset it filters automatically down to just this one value. Paginated Report on the other hand only can render what the PBI Datasets provide, therefore I have to make sure to load everything somehow in Power BI Dataset while the filter / parameter still have to work. Nevertheless, let’s test the Paginated Report in Power BI through the out of the box visual to see what will happen. To do so, I publish the Paginated Report to Power BI Service, switch back to Power BI Desktop and add the Paginated Report Visual into it. I add the ProductNumber field to the visual, hit Connect to Report, select my newly published Paginated Report, and hit Set Parameter. In there, I configure the Power BI field to map to my Parameter and hit See Report.

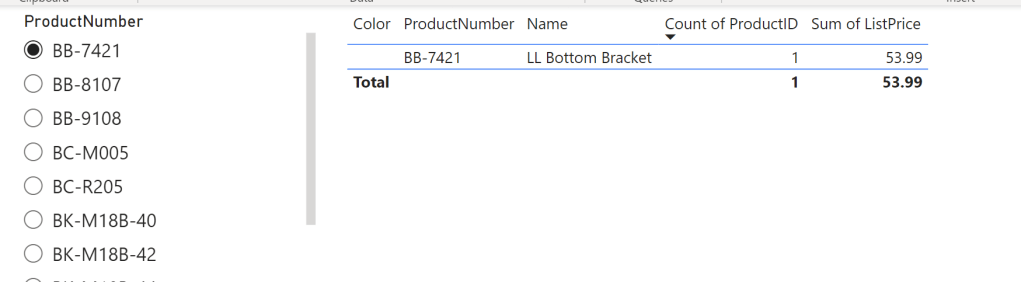
As expected, I get an error. The reason is I try to pass the “BB-7421” value to Paginated Reports, but it’s only aware of the “CA-1098” and therefore it throws an error.

Let’s fix it in my WHERE clause of the SQL Statement in which I filter down to get only one value right now. I need a way to pass “All” as default value to get all values back but once I select a value in my slicer, it should filter it down. On top, it should be multi value aware. For that, I adopt the SQL statement in SQL Server Management Studio and replace the = with “IN” and set the statement in brackets. Further, for testing purpose in SSMS, I declare a parameter and set it to “All”. Lastly, I create a CASE statement in which I check if the parameter is All and if so, then all values from ProductNumber column should be selected, otherwise only the value itself should be taken.

DECLARE @selectedProductNumber VARCHAR(50) = 'All';

SELECT p.[ProductID]
,p.[Name]
,p.[ProductNumber]
,p.[Color]
,p.[StandardCost]
,p.[ListPrice]
,p.[Size]
,p.[Weight]
,p.[ProductCategoryID]
,p.[ProductModelID]
,p.[SellStartDate]
,p.[SellEndDate]

FROM [SalesLT].[Product] p

WHERE p.ProductNumber IN (CASE WHEN @selectedProductNumber = 'All' THEN ISNULL(ProductNumber, '') ELSE @selectedProductNumber END )

After testing if the SQL statement works as expected by changing the parameter to All and different Product Numbers, I copy and paste the new SQL Statement to M in Power BI and update it to point to my parameter in Power BI. Be aware, that the DECLARE Statement is not needed here.

let
    Source = Sql.Database
            (
                paramServer,
                paramDB
            ),
    Query = "
            SELECT p.[ProductID]
                ,p.[Name]
                ,p.[ProductNumber]
                ,p.[Color]
                ,p.[StandardCost]
                ,p.[ListPrice]
                ,p.[Size]
                ,p.[Weight]
                ,p.[ProductCategoryID]
                ,p.[ProductModelID]
                ,p.[SellStartDate]
                ,p.[SellEndDate]

            FROM [SalesLT].[Product] p

            WHERE p.ProductNumber IN (CASE WHEN '" & paramProductNumber & "' = 'All' THEN ISNULL(ProductNumber, '') ELSE '" & paramProductNumber & "' END )",
    NativeQuery = Value.NativeQuery
                    (
                        Source, 
                        Query, 
                        null, 
                        [EnableFolding = true]
                    )
in
    NativeQuery

If I now change my paramProductNumber value the table reacts and if I put All into it, I see all values – perfect!

Before publishing, there is one thing left. We have to make the Parameter multi value aware so not only single values can be passed. To do that, we hit Close & Apply and switch to the model view. In there, I select the ProductNumber field and enable Multi-Select.

Now, switching back to the report view, I got another error.

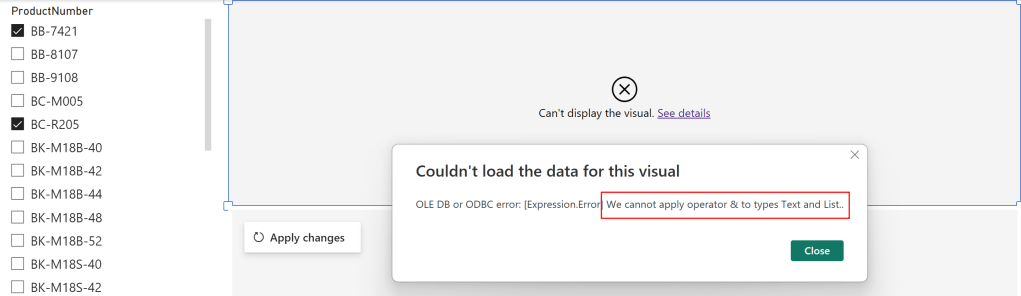
The reason for this error is again the M code as the Parameter is a Text and therefore Power Query expects a text value. But passing multi values converts the parameter to a List and it can not be matched, that’s what the error says at the end. To fix it, let’s go back to Power Query and open the Advanced Editor of the SalesLT Product table. In there, I add at the top a new step which checks if the parameter is of type list, and if so, convert it to text separated by single quotes. If not, it’s just passing the same value to the selectedProductNumber step. On top, I remove the single quotes in my WHERE clause as I’m providing them in the selectedProductNumber step already and change the reference now to my newly created step.

Now, I just click Close & Apply button, delete the table visual as it’s not needed anymore, and publish my report. Don’t get confused because of the error message the Paginated Report visual is still showing – we have to first update the Dataset in the Service to see the changes.

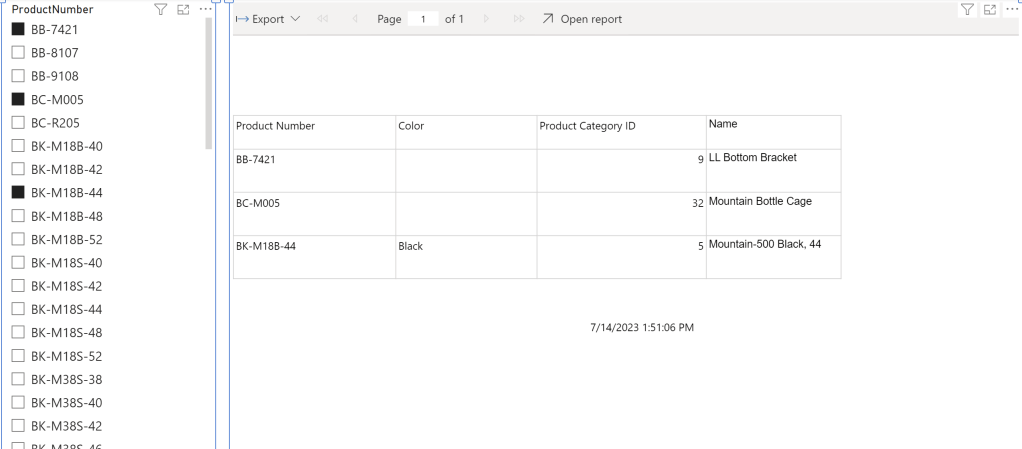
After successfully publishing the Power BI Report, I just hit apply changes in the Paginated Report Visual and see that my selection is now passing through! Even if I select multiple values, I can see the expected result.

Please let me know if this post was helpful and give me some feedback. Also feel free to contact me if you have any questions.

If you’re interested in the files used in this blog check out my GitHub repo https://github.com/PBI-Guy/blog

Starting a job after a Power BI dataset has refreshed

This blog post is a little bit special to me as the whole idea and text is not coming from myself but from my good friends Dirk Gubbels, Principal Consultant at Microsoft, and Gabi Münster, Fabric CAT/Senior Program Manager as well at Microsoft. They approached me asking if I would be willing to share the solution on my blog and how can I say no to such a request? 🙂 Feeling even honored that they considered my blog for their idea, I’m happy to share their walk-through how to start a job after a Power BI Dataset has been refreshed.

In some business cases, there may be a requirement to perform a number of tasks as soon as a Power BI Dataset has been refreshed. This can be sending out an email, starting another Dataset process, or rendering and distributing reports. This blog post will show in detail how this can be done.

Requirements

For this to work, the following components will be created:

  • A Power BI Report with
    • A Power BI Dataset, which process will trigger the task
    • A page with a card showing data related to the last refresh time
  • A Power BI Dashboard with a time containing information on the time of the last refresh
  • A data Alert that will trigger when the Dashboard tile changes
  • A Power Automate Flow to execute the required task

Each of the components will be described in detail.

Step 1: The Dataset

Any dataset can be used for this. In this example the dataset fetches data from the public northwind OData service at https://services.odata.org/V3/Northwind/Northwind.svc/ To have a few tables and data for the report, the following model is created:

Important: To enable the rendering of the report when the Dataset is refreshed, an extra table named ‘CubeMetaData’ is created, using the following M code:

let
    Source = #table({"ProcessedDateTimeUTC", "ProcessedMinutes"}, {{DateTimeZone.FixedUtcNow(),Number.Round(Duration.TotalMinutes( Duration.From( DateTimeZone.FixedUtcNow() - DateTimeZone.From("2020-01-01 00:00:00 +00:00")))) }}),
    #"Changed Type" = Table.TransformColumnTypes(Source,{{"ProcessedMinutes", Int64.Type}, {"ProcessedDateTimeUTC", type datetimezone}})
in
    #"Changed Type"

The 2nd column is needed to set the data alert, as currently data alerts cannot be set on date or datetime values. Therefore, a column with a numeric value must be created.

Step 2: Visualizing the processed date

In the Power BI report containing the dataset, create a page with 2 card visuals, one showing the ProcessedDateTime column and one showing the ProcessedMinutes column. This can be sum or first, does not really matter as there is only 1 row anyway. Make sure the card showing the processed minutes does not use any display units. The full detail of the number needs to be visible.

The left visual will not be used, but is added for troubleshooting purposes, to see if the cube was processed.

Step 3: Save and publish the report

Save the report and publish it to a workspace on Power BI.

Step 4: Create a Dashboard

The Power Automate Flow will be triggered by a data alert in Power BI. These data alerts are only available on Dashboards. So, the next step is to create a Dashboard with a single tile referring to the refresh date/time of the cube.

Open the report that was just published:

And pin the visual showing the numeric value of the processing time to a new Dashboard:

After creating the dashboard, open it.

Step 5: Create a data alert

On the Dashboard, click the ellipsis button at the top of the newly created tile showing the processed Datetime: If the ellipsis button (…) is not visible, try changing the size of the tile.

Choose ‘manage Alerts’ to create a new data alert, and click the ‘+ Add alert rule’ button. The alert should look similar to this:

The alert condition will always be true, but because the alerts are only sent when the data changes, this effectively becomes an alert sent on data change. The data will only change when the cube processes.

Step 6: Create the Power Automate Flow

With the data alert is set up, it is now possible to start a Power Automate Flow when the alert is triggered. To do this, either click the link at the bottom of the data alert details, or navigate to https://powerautomate.microsoft.com/

Sign in and select ‘templates’ at the left side of the screen. The template ‘Trigger a Flow with a Power BI Data-driven alert’ should appear on the bottom right of the screen. If it is not visible, just search for ‘Data driven alert’.

Select the template. On the next screen, you may be asked to validate the connection to Power BI:

Validate this and click continue. The flow editor opens.

For this sample implementation, a simple mail alert step is added. The goal is to see that the Flow gets started when the cube is processed, a full implementation will depend on the business case. E.g. to export Paginated Reports in Power Automate, use the steps explained at Export paginated reports with Power Automate – Power BI or check out PBI Guy’s Blog post https://pbi-guy.com/2023/02/03/export-paginated-reports-automatically-in-a-low-code-way-without-power-bi-premium/

The flow looks like this:

Ensure the flow is saved.

Step 7: Testing the solution

To test the solution, process the Dataset. Before the Dataset can be processed, the credentials need to be set. In this case, we’re using an anonymous OData feed. Go to the settings of the Dataset and click ‘edit credentials’ on the data source credentials.

Once this is done, the dataset can be refreshed.

As the alert will be triggered maximum once per hour, it is best to schedule a few automatic refreshes with a few hours in between, and compare the refresh history with the flow execution history:

This shows there is around a 5 – 7 minute delay between the refresh finishing and the Power Automate job starting.

Alternatively, a similar result can be achieved using Scorecards and Goal instead of a Dashboard and a tile.

Add-on from PBI Guy: You could also trigger a Dataset refresh via Power Automate and use the REST API to check the status of the Dataset Refresh. Once finished, the Flow could proceed and send as well an e-mail or whatever is required. This way you would have more control over the whole process, but would require more skills to call the Power BI REST API. Lastly, you could also create more complex rules by executing DAX statement against the Dataset via the REST API or Power Automate and check tresholds in Power Automate to trigger an e-mail alert.

Limitations

Please be aware that Data Alerts currently are not triggered if you refresh the Dataset using the XMLA endpoint or the enhanced refresh API.

Conclusion

The steps above explain how to create a Power Automate Flow that is executed after a Power BI Dataset is refreshed. This opens the door for many different business scenarios of tasks that need to run as soon as new data is available in a Power BI Dataset.

Once more, thank you very much for these insights Dirk and Gabi and I hope we’ll collaborate even more in near future!

Please let me know if this post was helpful and give me some feedback. Also feel free to contact me if you have any questions.

If you’re interested in the files used in this blog check out my GitHub repo https://github.com/PBI-Guy/blog

Create a POST request with Power BI

In my last post, I showed how you can connect to a REST API with Power BI by using a Service Principal. After that, I got quite a lot of comments and questions if it would be possible to also create a POST request with Power BI, not only a GET one. First, I thought it will not be possible as Power BI is a “read-only” tool, but I love challenges so I gave it a try. After a while, I found a way how to do so which I explain in this post!

Prerequisites

I’m going to use the PBIX file I created before to connect to the Power BI REST API. But instead of listening all workspaces, I’m going to execute a DAX statement and calling the Execute Queries in Group REST API (https://learn.microsoft.com/en-us/rest/api/power-bi/datasets/execute-queries-in-group). Therefore, following things are needed

  • Power BI Desktop
  • a Service Principal
  • Sufficient permission to call the REST API
  • a published Power BI Dataset to execute a DAX statement against it

Let’s start

I’m not going to walk you through how to use a Service Principal and authenticate against the Power BI REST API with it. You can find it in my previous blog post here (https://pbi-guy.com/2023/03/25/connect-with-power-bi-to-the-power-bi-rest-api-with-a-service-principal/). To easy things up, I’m going to use the PBIT file from the last post, which you can find in my GitHub here.

Once opened, I enter the required parameters as seen below and hit Load.

After the data loaded successfully, I enter Power Query Editor by hitting the Transform data button in the ribbon. Once here, I select New Source – Blank Query.

As we have to do some M-Language on our own, we can’t use the Web Connector to create a POST request. Therefore I start with a blank query. Once loaded, I select Query1 and hit Advanced Editor to open the M-Language Editor.

I’ll now create step by step my URL with the request body and will combine afterwards everything into one step. So let’s start with the URL. According to the documentation, the URL to execute a DAX statement looks as following:

POST https://api.powerbi.com/v1.0/myorg/groups/{groupId}/datasets/{datasetId}/executeQueries

This means we need a Workspace (group) ID as well as a Dataset ID. Heading over to powerbi.com, I’m selecting a Dataset on which I wish to execute my DAX statement. Now, I can find the needed details in the URL.

Copy and pasting the ID into my Power BI M-Language, I got now following line.

Because I want to parametrize my URL as well as my DAX statement, I press Done, select Home Ribbon – Manage Parameters, and create three new text parameters called paramWorkspaceID, paramDatasetID, and paramDAX. The last one is for my DAX statement, which I also wish to parametrize. For my DAX parameter, I use a simple code to evaluate the Top 10 Cities from my Dataset. Important to note, I need the quotation at the beginning and at the end of my DAX statement.

Now let’s go back to my Query1, hit Home Ribbon – Advanced Editor. After the window for M-Language pops-up, I replace the hardcoded Workspace and Dataset ID to replace it with my new parameters. To do so, I add a quotation in front and at the end of the ID, add a & at the same position, and replace the id with the corresponding parameter.

Next, let’s create the required body. I add a coma at the end of my URL step, call my next step Body, and copy & paste the body from the doc between two quotations. To make it a little bit more readable, I format the body as seen below. Important, I have to reference my new step at the end after “in”.

As the body includes quotations, we have to make sure they will be recognized. Therefore, I format the body and add another quotation to each already existing one. Further, I remove the serializerSettings and the impersonatedUserName as those attributes are not needed in my case. Lastly, I included my DAX parameter after the query attribute. Now, my M-Code looks like following and the Token warning message at the bottom is also gone.

As a next step, I have to make sure the body is recognized as JSON format. All I need to do is to add another step, naming it (Parsed_JSON in my case), and use the function Json.Document(Body). At the end I also need to reference to my last created step in the in clause. This step is not really required for the whole purpose, it’s just making sure the body is a valid JSON format.

Making sure everything works as expected, let’s hit Done and check all steps. If I select the URL step now, I should see just a URL including Workspace and Dataset ID we’re going to call. Looks good so far.

If I check the Body step, a JSON format-like body should be visible. If I compare it with the documentation, it should be more or less the same without any additional quotations or anything else, including my DAX statement coming from my parameter. Looks also good.

In my last step, Parsed_JSON, I should see a Record “List” which I can transform to a table. This indicates that the conversion to JSON has been successful and that we don’t have a typo in our Body step.

Now, we’re ready to call the URL. I create a new step called “Source” and use the Web.Content Connector (which is the Web Connector). In there, I provide first the URL I wish to call which is coming from my URL step. Next, I have to specify the Header information. To do so, I open square brackets and add Headers=[]. In the second square brackets, I have to add the Authorization and the Content-Type. The Authorization is coming from our previously created function (see my last blog post) and the Content-Type is “application/json”. After closing the second square brackets, I have to provide the body to execute our DAX statement. I’ll do this with “Content = Text.ToBinary(Body) referencing to my Body step. At the end, I have again to reference to my last step “Source” in M.

After hitting done, I should be able to get a result now.

If you see “Expression.Error: Access to the resource is forbidden.” try to refresh the table to execute the fnGetToken function to get a new token. If it still doesn’t work, make sure your service principal has sufficient permission to the Dataset.

I now hit the “Into Table” button in the Convert Ribbon. Afterwards, I select the two arrows and hit Expand to New Rows.

As a next step, I almost do the same like before by selecting the two arrows, deselect “Use original column name as prefix” as I don’t need that, and hit ok.

Those steps have to be repeated three more times until you get following screen.

Now, we just have to expand it one more time to get our final result!

At the end, I wish to give a proper name to my Table (renaming from Query1 to POST Request Execute DAX), specify data types for each column and remove / transform as I wish. My final result looks like following.

And the M-Code behind can be seen below.

let
    URL = "https://api.powerbi.com/v1.0/myorg/groups/" & paramWorkspaceID & "/datasets/" & paramDatasetID & "/executeQueries",
    Body = "
        {
            ""queries"": 
            [
                {
                ""query"": "& paramDAX &"
                }
            ]            
        }",
    Parsed_JSON = Json.Document(Body),
    Source = Json.Document(
        Web.Contents(
            URL, 
            [
                Headers= [
                    Authorization=fnGetToken(), 
                    #"Content-Type"="application/json"
                    ],
                Content = Text.ToBinary(Body)
            ]
        )
    ),
    Results = Source[results],
    #"Converted to Table" = Table.FromList(Results, Splitter.SplitByNothing(), null, null, ExtraValues.Error),
    #"Expanded Results" = Table.ExpandRecordColumn(#"Converted to Table", "Column1", {"tables"}, {"tables"}),
    #"Expanded Tables" = Table.ExpandListColumn(#"Expanded Results", "tables"),
    #"Expanded Record" = Table.ExpandRecordColumn(#"Expanded Tables", "tables", {"rows"}, {"rows"}),
    #"Expanded List" = Table.ExpandListColumn(#"Expanded Record", "rows"),
    #"Expanded All Records" = Table.ExpandRecordColumn(#"Expanded List", "rows", {"dimCity[City Key]", "dimCity[City]", "dimCity[State Province]", "dimCity[Sales Territory]"}, {"dimCity[City Key]", "dimCity[City]", "dimCity[State Province]", "dimCity[Sales Territory]"}),
    #"Changed Type" = Table.TransformColumnTypes(#"Expanded All Records",{{"dimCity[City Key]", Int64.Type}, {"dimCity[City]", type text}, {"dimCity[State Province]", type text}, {"dimCity[Sales Territory]", type text}})
in
    #"Changed Type"

I also created a PBIT file which can be found in my GitHub repo.

This way we created a POST Request to a REST API and got a result back with Power BI – awesome! Nevertheless, I still wouldn’t recommend to go this way as the Client Secret as well the Client ID has to be exposed in a parameter which is definitely not secure. I haven’t crossed an alternative so far to securely store a password in Power BI except of building an own connector.

Please let me know if this post was helpful and give me some feedback. Also feel free to contact me if you have any questions.

If you’re interested in the files used in this blog check out my GitHub repo https://github.com/PBI-Guy/blog

Trigger Python script from Power BI and get result in near-real time back to Power BI

Working with Data Scientist I got quite often the question if Power BI is able to trigger a Python (or R) script to recalculate scenarios and show the result more or less immediately in Power BI again. On top it would be great to be able to pass parameters from Power BI to Python so an user can influence the script. As you guessed it right – because I’m writing this blog post – it is possible! But not purely with Power BI but rather in combination with other (Microsoft) services.

First things first

Before I deep dive into a solution, I want to make sure a common understanding of the issue is given. First of all, Power BI is a reporting tool. As such, it relies on data sources to be able to connect to some kind of table and visualize the result. It is a purely “read-only” visualization and not a “writeback” tool. Therefore having some kind of input mechanism, to be able to pass parameters to a Python script in our case, does not work with purely Power BI.

Further and as already mentioned, it has to connect “to something”. This means we can not execute a Python script on the fly and check the result. Yes, you can use Python in a visual and do some kind of visualization on the fly, but that’s in most cases not sufficient as just a few libraries are supported (https://learn.microsoft.com/en-us/power-bi/connect-data/service-python-packages-support). Yes, you can also have Python as Data Source, but to be able to recalculate a new scenario you would need to refresh the Dataset every time. Imagine multiple users accessing the same report and one of them is triggering a Dataset refresh – this will for sure lead to confusion for other users if the data changes while accessing the report. Therefore we’re looking for a way to independently run a script, store the result in a way Power BI can access and show it in near-real time, and on top pass parameters from Power BI to the script.

Which services to choose

Let’s go step by step and see which service we can use. First of all, we need a Python script. As you probably have noticed, I’m a big fan of Azure Synapse so let’s use the Notebooks from there and write our Python code in PySpark. The result has to be stored somewhere so Power BI can access it in near-real time. This means the data source has to support DirectQuery, otherwise we would need to refresh the Dataset every time the script runs. Thus, Azure SQL dedicated pool would be a great choice, but on the other hand I would need to make sure it’s running while users are accessing the report. So I’ll focus on a more cost-effective way and try to use SQL Serverless. As you can connect to files through SQL Serverless and run SQL queries on top, I will save the result from my Python script as parquet files in my Azure Data Lake Storage Gen2.

Next, I have to make sure my Python script can be executed whenever needed. This requirement can be fulfilled by using Synapse Pipelines. This way I can call the Synapse Pipeline REST API and trigger a run whenever needed. Further, Synapse Pipelines can be parametrized and those parameters can be passed further to the Python script. On top, I can also pass the Pipeline Parameters through the REST API – perfect!

As a last step, I need some kind of input mechanism in Power BI to be able to influence the parameters and trigger a Synapse Pipeline run. For such scenarios, Power Apps is the right choice! Microsoft offers an out-of-the-box visual which can be used to integrate a Power Apps app providing input fields. Further, a button can be defined which will trigger a REST API call or – even better and more scalable – trigger a Power Automate flow which will trigger the Synapse Pipeline.

Here’s an overview of all the services mentioned and used in this solution:

  • Power BI
  • Power Apps
  • Power Automate
  • Azure Synapse
  • Synapse Pipeline
  • Synapse Notebook
  • Azure Data Lake Storage Gen2
  • SQL Serverless Pool

The main idea of this blog post is to showcase that, in general, it is possible to trigger a Python (or R) script from Power BI. Looking from a performance point of view, I wouldn’t choose Synapse Pipelines but rather Azure Functions as it will execute the Python script much faster. Further, in a production environment, I would store the result in a SQL Dedicated Pool (or Azure SQL) and not go through the Serverless one as the performance can be influenced much better rather then connecting to parquet files. Lastly, creating multiple, small parquet files in ADL Gen2 is also not considered as best practice but rather creating fewer but bigger files. On the other hand going through Synapse Pipelines showcase the scalability of the whole solution.

Let’s roll up our sleeves and get started

Let’s start by creating a simple Python script which takes two numbers as parameter and add them up. Because the report will be used by multiple users at the same time, I have to make sure on one hand that the different calculated scenarios will be stored properly and on the other hand users will identify their scenario. For that reason I create three more parameters for User Name, UPN, and timestamp. Those parameters have to be influenced from outside as they are changing depending on the user. But before defining the parameters, I also add the necessary libraries.

#Import necessary tables
from datetime import datetime
import pandas as pd
#Define standard parameters which can be called from outside
firstNumber = 7
secondNumber = 1
user = 'Chewbacca'
upn = 'chewbacca@kbubalo.com'
timestamp = datetime.now()
timestamp_string = timestamp.strftime('%Y_%m_%d_%H_%M_%S')

In my next block of code I define further parameters which should not be influenced from outside. This includes my ADL Gen2 storage account, my container, folder, and file name. I decided to create a folder for each user in which each scenario should be saved to be able to differentiate between the users.

adlgen2 = '...'
container = 'dev'
folder = '15 Demo/Trigger Python from Power BI via Power Platform/' + user
fileName = 'Scenario'

Next, I create a DataFrame to store the parameters as well as the result (adding number 1 and 2).

#Create dataframe with provided data
d = {'firstNumber': [firstNumber], 'secondNumber': [secondNumber], 'result': [firstNumber + secondNumber], 'user': [user], 'upn': [upn], 'timestamp': [timestamp]}
df = pd.DataFrame(data=d)

Lastly, I store the DataFrame as parquet file in my configured ADLS Gen2.

#Store Dataframe as parquet file
df.to_parquet('abfss://' + container + '@' + adlgen2 + '.dfs.core.windows.net/' + folder + '/' + fileName + '_' + timestamp_string + '.parquet')

To make sure my defined parameters can be influenced “from outside” (this means form Synapse Pipeline in this case), I have to mark them as such. Therefore I select the three dots to the block of code and select Toggle parameter cell.

If done correctly, you’ll see a “Parameters” in the bottom right corner of your code block.

Once done, let’s test the script by running it and check if a parquet file is created as wished – looks good! A parquet file is created in my ADLS Gen2 and the result is as expected.

My next step is to create a Pipeline and pass parameters from the Pipeline to my Notebook. In Azure Synapse there is a small icon at the top right to automatically create a Pipeline out of your notebook. I just select it and hit New Pipeline.

The Azure Synapse Pipeline window will open up. I rename my Pipeline to “PBI Guy Trigger Python” and add 4 Parameters by hitting the + New in the Parameters section of the pipeline. Make sure you’re not selecting the Notebook but the Pipeline. I name my parameters like the one in the Notebook and give them a proper type as well as a default value because I want to test my pipeline afterwards making sure the parameters are passed.

The Parameter name do not have to match the names from my Python code but it makes sense to name them the same way.

Next, I select the Notebook activity, choose Settings tab and expand Base parameters. Again, I add 4 parameters and assign the correct type to them. Keep in mind, these parameters have to match exactly with the names from your Python Notebook. Once done, I select Add dynamic content and select my Pipeline Parameter to the corresponding Parameter and hit ok.

Once done, let’s test the Pipeline as well by hitting “Debug” at the top. If wished, you can change your parameters now as a Pane will pop up on the right hand side of your screen. I just confirm by clicking OK. After roughly 3 minutes in my case the Pipeline run successfully and I see a folder with my name including a parquet file has been created. By right-clicking on it and selecting New SQL Script – Select TOP 100 rows I can check the result making sure my parameters has been used in thy Python script – looks good so far! Don’t forget to publish the Pipeline now.

Now, I have to trigger the Pipeline through the REST API. Luckily, Microsoft provides a great documentation here which highlights the REST API call. As we see it’s a POST call to {endpoint}/pipelines/{pipelineName}/createRun?api-version=2020-12-01. {endpoint} in this case means the Development endpoint of my Azure Synapse workspace which can be found in Azure Portal by selecting the workspace in the overview section. You can easily copy it by selecting the copy button right next to it.

To trigger the Pipeline through the REST API I’ll create a Power Automate flow which will be triggered from Power Apps. As I wish to connect the Power BI Dataset with my Power Apps app I have to start in Power BI and create a report on top. For that, I just open Power BI Desktop, create a dummy table by entering a random number into the table, and add the Power Apps Visual. If you need a step-by-step guidance how to create a Power Apps starting in Power BI check my previous blog post here: https://pbi-guy.com/2021/11/17/show-secured-images-in-power-bi/ It will walk you through the most important steps. Further, I’ll focus on connecting to the right data in a later stage therefore the dummy table.

If you have issues in Power BI Desktop and the Power Apps app won’t load try it in the Service. You can easily publish the empty report and modify it from the browser. Once done, you can download the PBIX file again.

Once done, I just add my dummy column into the fields section and hit Create New in the Power Apps visual. This will open a the Power Apps studio where you can create your app. I will not walk you through on each step how I created my app but rather focusing on the most important parts on a high level. If you’re interested in the final solution, you can check my GitHub repo.

I add two Text Input objects as well as two labels making clear what the input should be. Further, I add a button which will trigger a Power Automate flow and provide the values from the Text Input fields as parameters to the flow. Once added, I rename each object making sure each one of them has an appropriate name – this will help me referencing it later on.

In the screen shot above you’ll see some further objects. Those are added to make the app more appealing and are not crucial for the whole process.

Next, I select the button and make sure the OnSelect property is active (see red box), head over to Power Automate on the navigation pane, hit Create new flow and select + Create from blank.

A new pop up window will appear where a flow can be created. Again, I will not walk you through the whole process of creating the flow but rather focusing on the most important steps. A step-by-step guide how to create a flow and to familiarize yourself with it can be found in one of my previous blog posts here.

The first thing I do is to specify all needed variables. As I wish to call the REST API with a Service Principal, I create one in the Azure Portal (how to create a Service Principal can be found here), give no API permission but rather add the Service Principal as Synapse Credential User in the Synapse Portal (see Synapse RBAC roles for further details about permissions).

Therefore, I create following variables in my flow:

  • Tenant ID
  • Client ID
  • Audience for Azure Synapse (can be found in the documentation here)
  • Azure Synapse Development Endpoint
  • Synapse Pipeline Name (this is the name of the Pipeline, in my case PBI Guy Trigger Python)

I also specify an action to get the secret of my Service Principal from Azure Key Vault as I have stored my secret there. Otherwise you can also just store it in a variable but this is not the recommended way.

As a next step I add a HTTP request which looks like following:

I choose POST as Method, put in the REST API URI but replace the hardcoded parameters with my variables from the previous steps. In the body I specify my Pipeline Parameters. To get them from Power Apps, I place my cursor to the right position and select from Dynamic content “Ask in PowerApps”. This will create automatically the necessary dynamic content. As Authentication I choose Active Directory OAuth and provide the necessary variables.

This is already enough to trigger our Synapse Pipeline. Now, we just have to provide the input from Power Apps input fields to the Power Automate flow. So let’s save our flow, select the button, and on the OnSelect property specify what should happen. We can reference to the flow by name and select Run as attribute. In the brackets we can now add values to the variables we specified in the body of our HTTP action in the flow. To do so just reference to the input object and add Text as attribute. On top I’m using the out of the box User object to provide the full name and email. In my case the code looks like following.

'PBIGuy-TriggerPythonfromPowerBI'.Run(
    txtinp_number1.Text,
    txtinp_number2.Text,
    User().FullName,
    User().Email
)

Now let’s test it by running the app, provide some numbers and hit the button. If everything is set up correctly, the flow as well as the Synapse Pipeline will run successfully. In my case it took roughly 1 minute and I can see the result in my ADLS Gen2. This is great! As everything works I save and publish my app.

To make the app more user friendly, I modified the flow further to call the REST API to get a current status of the Synapse Pipeline. I do a loop until the Pipeline gives a Succeeded message which I give back as response to the Power Apps app. On top I’m using a loading gif while the whole flow is running. Once finished, the gif will disappear and I trigger a Dataset refresh making sure the latest data will be loaded.

Note that your Service Principal needs additional permission to be able to read the status through the REST API, for example the Synapse Monitoring Operator.

One of my last steps is now to connect the dots with Power BI. Through SQL Serverless Pool I can read parquet files with the OPENROWSET statement, but this is not supported with Power BI. As we need a way through DirectQuery to access the files, I create an External Table in my SQL Serverless Pool by just going to my file, right click on it, select New SQL script, and choose Create external table.

In the pane on the right hand side I select to continue. Afterwards I configure in which SQL Pool as well as which database my external table should be created, give it a name, and choose “Using SQL script” to get the full control of the script.

As I haven’t created the pbiguy schema yet, I just add a line of code to do so. Further, I modify the location to not point to a single file but rather to the overlaying folder by adding two * at the end.

If everything worked as expected you will get a table with all scenarios for all users so far.

Now we can connect with Power BI through the SQL Serverless Endpoint. This one can be found in the Azure Portal in the overview of our Synapse workspace.

Back in Power BI Desktop I select Azure Synapse Analytics SQL, configure the connection, choose DirectQuery, and paste a SQL Statement to select all columns and rows. Once done, I create a simple table visual right to the Power Apps visual. This way we can make sure the scenario will be visible once the whole process has finished. Now let’s do a final test and provide some data and calculate our scenario. Once I add some numbers and hit the button, I have to wait till my process has finished. In my version I added a rocket as gif to indicate the process is running (see comment above).

Once done, I see immediately the result in my table!

That’s it, it works! This way multiple users can access the same report, calculate their scenarios and through filter options (or even with RLS) you can make sure that each user can select his or her scenario.

Some last thoughts

As much as I love the whole solution there are still some things to consider. As written above, the main idea was to prove that from Power BI you can trigger a Python (or R) script and get the result back in near-real time. With Azure Synapse you have unlimited scalability. On the other hand it takes quite long to process the whole request and the bottle neck is the Synapse Pipeline. If you, like me, add a “Respond to a Power Apps” action at the end of your Power Automate flow, it could be that you get an error in the app if the flow runs longer than 120 seconds (this is the timeout limit of the action) like the one below.

Especially if you run it for the first time, Synapse Pipeline will take longer as it has to spin up. Therefore I would suggest to try Azure Functions as I’m expecting a much faster process time.

Further and as well mentioned at the beginning, instead of storing individual and multiple small parquet files, I would rather store it directly into an Azure SQL DB.

Please let me know if this post was helpful and give me some feedback. Also feel free to contact me if you have any questions.

If you’re interested in the files used in this blog check out my GitHub repo https://github.com/PBI-Guy/blog

Export Paginated Reports automatically in a low-code way without Power BI Premium

From time to time I got asked how customers can export Paginated (or Power BI) Reports automatically to store them e.g. in OneDrive or any other location. One way is obviously to do it manually, but we’re looking for an automatic way. So why not use the out-of-the-box Subscribe button within Power BI Service? Because it will send you an email and you can’t decide to store it somewhere else. Luckily, Power BI offers an API to achieve what we’re looking for. But what if I’m not a developer and don’t know how to write code e.g. in PowerShell or Python? No worries, Microsoft got you covered with Power Automate!

Prerequisites

There are a few things which are needed to be able to follow this approach. First of all, Paginated Reports are part of a Power BI Pro license BUT if you wish to export a Paginated Report automatically, you still need a capacity (Premium or Embedded) to be able to do so. Reason is to make sure the end user is licensed in a proper way because through Premium the end user requires only a Free license. If you try to export a Paginated Report through the API backed up with a Pro license, you’ll get an error as you can’t make sure the end user also have a Pro license. That’s the reason why a capacity is needed. But buying Power BI Premium just to be able to export PDFs automatically is probably an overhead. Therefore we’re looking for a more cost-effective way which can be achieved with Power BI Embedded. Why? Because Power BI Embedded can be paused and it will not generate any cost at all! So we can turn it on just when needed, export our PDFs, and shut it down afterwards! Keep in mind while Embedded is paused the Reports in the associated workspaces will not be accessible.

So here’s a list of what we need:

  • Power BI Pro license
  • Power BI Embedded
  • Power Automate license
  • Service Principal with sufficient permission
  • Basic understanding of REST API
  • Basic know-how of DAX

Because we’re going to call the REST API to start and pause our Power BI Embedded capacity with Power Automate, the HTTP connector is needed which is Premium (as of February 2023). Therefore the O365 included licenses is not enough as “only” Standard Connectors are included.

If you’re interested in Power Automate Licensing please check the actual guide. Prices can be found here: https://powerautomate.microsoft.com/en-us/pricing/

Setting the scene

For my example I’m going to reuse the Sales Analysis Paginated Report from the Paginated Report in a Day course. I want to create one PDF for each Fiscal Year automatically and save each PDF into OneDrive.

I published the Report to my “Demo” workspace which is backed up by an Embedded Capacity. Creating an Embedded Capacity is straight forward through the Azure Portal. A how-to guide can be found here: https://learn.microsoft.com/en-us/power-bi/developer/embedded/azure-pbie-create-capacity, For our example the smallest (A1) SKU is enough.

Further, I prepared a folder in OneDrive called “Demo” where I wish to save my PDFs.

Let’s get started with Power Automate

Once I logged in into Power Automate via https://flow.microsoft.com/en-us I select “+ Create” on the left hand side and select “Instant cloud flow”. This means I can trigger my flow manually which is handy during development. Once done, I can change the trigger to e.g. a schedule like every Monday morning at 7am. After the new window pop up, I name my Flow as wished (PBI Guy – Save PDF from Paginated Reports), select “Manually trigger a flow”, and hit the Create button.

Let’s first test if I can save a PDF export into OneDrive and focus on starting & pausing the Capacity in a next step. So our first step is to get the PDF and then save it into OneDrive. To create a new action, just select the + New Step. Now, search for Power BI and select the build-in Power BI Connector. Once selected, scroll and search for “Export To File for Paginated Reports”.

Afterwards, we have to configure our action by selecting our Workspace, Report, wished Export Format, and specify our Parameter which is Fiscal Year in this case. Be cautious by naming the Parameter as you need the internal name, not the label of the Parameter. Therefore you have to open the Paginated Report with Report Builder and check the internal Parameter name.

In my case it’s called “DateFiscalYear”.

Now that I have all needed details I switch back to my Flow and configure the action by selecting the Workspace (Demo), afterwards a list of my Paginated Reports will appear where I select the Sales Analysis, and choose my wished Export Format. Per default it’s PDF but you can also choose another option if you wish. Next, I provide the Parameter name and add a Value (FY2019) for testing purpose.

Next, I add a New Step by hitting the button, search for OneDrive, select OneDrive for Business, and select “Create File” as new action.

Afterwards, I just configure the Path by selecting the small folder icon and browse to my wished destination. I add FY2019.pdf as file name and choose the File Content from the dynamic content pane as File Content for my action. If you somehow don’t see the dynamic content, just hit the button at the bottom right to expand it.

Let’s test the flow and see if a PDF will be saved into OneDrive. To do so just click at the top right on the Test button. A new pane will appear, just select Manually and hit Save & Test.

Running it the first time I need to sign in to the different connectors I’m using (Power BI and OneDrive). Just Continue to do so and hit as last step Run Flow. Keep in mind that the Power BI Embedded capacity has to run otherwise you’ll get an error as the Report is not available.

After approx. 1 Minute our Flow will finish and checking OneDrive I can see a new PDF has been created. Great! Opening it shows me that even the Parameter FY2019 has been passed and I see only FY2019 data – awesome! But now let’s parametrize it a little so my Flow will create a PDF for each FY available and not only FY2019. To do so I switch to Edit mode by selecting the appropriate button at the top right and add a new step right after our manual trigger by clicking on the + sign. I again search for Power BI and choose “Run a query against a dataset” as action. In here I select again my Demo workspace and Sales Analysis Dataset. The idea is now to run a DAX statement against the Sales Analysis Dataset to get all FY values which we will reuse to generate our PDF and save it. I quickly open DAX Studio, connect to my Dataset, and generate an EVALUATE DAX statement to get all FY values of my date table.

EVALUATE DISTINCT('Date'[Fiscal Year])

ORDER BY 'Date'[Fiscal Year]

I copy and paste the whole DAX statement into the query text of the action in my flow.

Again, to test if it works, I rerun the Flow and check the Output of my new action. As I can see there are different FY values as expected – perfect! I copy the whole output as we will need it for our next step.

I switch back to Edit mode and add a new step between the two Power BI actions. I search for JSON and select the Parse JSON action. Next, I add into the Content field the “First table rows” dynamic content from my previous step. Lastly, I hit the Generate from sample button and paste the result I copied a few seconds ago. This will automatically create a schema.

This step is needed to be able to get each value and reuse it afterwards to create for each FY a PDF. Before I move to my next step, I want to rename my Actions making sure by just reading them each user can understand what is happening. To do so, just select the three dots for each step and rename it accordingly. In my case I renamed the steps as following.

Now, let’s parametrize our Export to reuse the FY values dynamically. To do so, I select the Export action, scroll down to ParameterValues value section, delete my hard coded FY2019 and add Date[Fiscal Year] as dynamic content from my previous step. This will automatically create a “Apply to each” around my step.

Next, I drag and drop the “Save PDF into OneDrive” action into the Apply to each container and position it below the Export action. Lastly, I delete the hardcoded file name and again add the Date[Fiscal Year] dynamic content and add .pdf at the end. Otherwise it will not be saved as such.

Again, let’s test our flow and check the result. After roughly 4 minutes our flow has finished and I see 6 different PDFs in my OneDrive, one for each FY – awesome!

Now we have to make sure to pause the Power BI Embedded Capacity once the job is done. Also, we want to make sure it starts once the flow has started otherwise the PDFs can’t be generated. Let’s first focus on starting the capacity.

The official Microsoft Documentation shows the necessary REST API call to start resp. resume the capacity. There are different parameters which are needed:

  • subscriptionId
  • resourceGroupName
  • dedicatedCapacityName

The full POST request looks as following:

https://management.azure.com/subscriptions/{subscriptionId}/resourceGroups/{resourceGroupName}/providers/Microsoft.PowerBIDedicated/capacities/{dedicatedCapacityName}/resume?api-version=2021-01-01

So let’s create these three parameters in our Flow to make it easier to use and reuse them. After switching back to my Flow I add a new action right after the trigger to create the parameters as a first step. I search for Variable and select “Initialize Variable”. I name the first variable “Subscription ID”, make it a String type and enter my Subscription ID as Value. If you don’t know the Subscription ID, just check it in your Azure Portal by selecting the Embedded Capacity.

I rename my action from Initialize variable to Define Subscription ID Variable and redo the steps for Resource Group Name and Dedicated Capacity Name Variables.

Now, let’s try to call the REST API with the HTTP action. Again, just hitting the + Button after my variables and search for HTTP. Once selected, I can configure it. The Method we have to use is POST based on the documentation. In the URI field I copy and paste the whole REST API call. Once copied, I delete the general parameter from the URL (everything between and including the {}) and replace it with the previously created variables from the dynamic content pane. In the Headers section, I add Content-Type as key and application/json as value. Because the REST API is not publicly available we have to log in somehow to be able to call it. Therefore, we can expand the advanced options and choose our authentication method. As I work mostly with Service Principals, I select Active Directory OAuth. Once selected, there are a few more things to fill out.

In one of my previous blog posts I showed how to create a Service Principal (https://pbi-guy.com/2022/03/10/power-bi-and-activity-logs-with-python/) and also did a walk-through how to give the sufficient permission to the SP to start and pause the Embedded Capacity (https://pbi-guy.com/2022/09/22/assign-power-bi-workspaces-to-a-capacity-automatically/).

Let’s see how we can get the needed details. The Client ID as well as the Tenant ID can be found in the overview of the Service Principal.

The Secret can be generated from the Service Principal or, like in my case, I have it stored in Azure Key Vault so I add a new step before the HTTP Call to get the secret out of it. To do so, again, I hit the + button, search for Azure Key Vault, and select Get Secret. In there, I can select the different Service Principals I have access to but because I have to provide the Client ID in the HTTP request as well, let’s parametrize it and create a variable one step before called Client ID. Further, let’s add a variable for the Tenant ID as well. Once done, I can now use the variable within my Get Secret action by selecting Enter custom value and select the Client ID variable.

Further, I can now add the variables to the associated places in my HTTP action and use the value of my Secret action. Lastly, Audience have to be added which is in this case https://management.core.windows.net.

Let’s try and run our Flow to test it. If everything is set up correctly, you’ll get an error because the Power BI Embedded capacity is already running and you can’t start it again. Therefore following error will appear:

This means we need to check the status and, if it is paused, call the API, otherwise skip this part. And how can we check the status? Through REST API! Power BI offers an admin call to get all capacities (see https://learn.microsoft.com/en-us/rest/api/power-bi/admin/get-capacities-as-admin) We’re going to call it and check the status. So let’s create another HTTP request above the current one. This time, according to the documentation, we use a GET method and paste https://api.powerbi.com/v1.0/myorg/admin/capacities into the URI field. As headers we use again Content-Type as key and application/json as value. To be able to authenticate I’m going to use again my Service Principal and luckily, I have everything stored in variables so I can just put them into the right place. Only the audience will change this time as we’re connecting to Power BI now, not to Azure, therefore I have to use https://analysis.windows.net/powerbi/api for it.

If I run the Flow now, it will still fail at the second HTTP action, but I get the result of the Power BI REST API and can check what the status is of my Embedded Capacity.

As a next step, I want to filter the result to only my capacity and extract the status. To be able to do so, I have to parse the body again to JSON and filter it afterwards. So, I copy again the whole body from the HTTP request and switch back to Edit mode. Once there, I add a new step after the Power BI REST API call and search for JSON and select Parse JSON. As content, I add the Body and generate the schema from a sample again by pasting it into the window after I hit the Generate from sample button. Now we have generated an Array which can be filtered. Therefore as next step I search again for Filter Array and select it. I put value from my previous step into From, select displayName as value on which I wish to filter and say it should be equal to my variable Capacity Name.

Now, that we filtered our result down to our desired capacity, we can do a check on the status. Let’s add a new step and search for Condition. In there, I add state from my previous step and configure is equal to “Active”. Once state is added as dynamic content, an Apply to each container will be automatically created. Just leave it as it is.

As next step, I drag and drop the HTTP request to start my capacity into the “If no” stream. This means, if the status is active, I don’t have to call the API to start it but if it’s not active, I would like to start it via REST API. As Power Automate will not wait until the Capacity is running and just continue to the next step, I want to make sure the capacity is in the desired state by adding a delay action of 30 seconds. Obviously, I could create a loop calling the Power BI REST API checking the status and, once changed to active, to proceed, but I’m not interested in the most performant way to execute this Flow but rather in an efficient, low-code way. Therefore the easiest method is to just add a delay.

Let’s one more time test our Flow making sure it’s working as expected. You’ll see, because the capacity is still running, it will go the “If yes” path and not call the REST API this time to start it. Therefore no error occurred and the PDFs have been generated again – great! And as you see the PDFs have been overwritten as we’re using the same name. This is expected behavior.

As a last thing we have to make sure now that our capacity will pause once the Flow is done. Again, checking the documentation there is almost the identical REST API call to pause resp. suspend the capacity. All we need to do is change “Resume” to “Suspend”. To be as sufficient as possible, let’s go to our Start Power BI Embedded action, hit the three dots, and choose Copy to my clipboard.

Now, I hit the + New step at the bottom of my flow, switch to My clipboard and select the copied action.

All I have to do now is to rename it and adjust the URI. What a time saver!

That’s it! Let’s test our final Flow by running it again. After roughly 4-5 minutes the Flow is done and I see on one hand that new PDFs have been created in my OneDrive and on the other hand my Power BI Embedded Capacity is now paused.

Let’s run it again making sure if the capacity is paused that the Flow will start it, still create the PDFs, and then shut it down. And again, after like 5 minutes it was successful. Checking the condition action in the Flow, we see the expression was false (capacity status is not active) and it went the right path to start it – perfect! During the run you could also refresh the page in Azure Portal to check the status of your capacity and you’ll see how it changed from Paused to Active and back to Paused.

The really last thing now is to delete the manual trigger at the top and replace it with what’s needed. E.g. a Schedule to run it every Monday 7:00am like in this example. Obviously, you can also choose other triggers depending on your needs. Keep in mind that Power BI offers a Power Automate visual out-of-the-box which can be used to trigger our Flow as well – from insights to action!

Please let me know if this post was helpful and give me some feedback. Also feel free to contact me if you have any questions.

If you’re interested in the files used in this blog check out my GitHub repo https://github.com/PBI-Guy/blog

Save cost by removing unused (Power BI) licenses

In recent discussions with customers, I almost got every time the same question when we talk about administrating and governing the environment: How do we know who REALLY needs a Power BI Pro license? The root cause of this question is obviously the urge to save cost and not to spend money on unused licenses. On the other hand, if a Power BI admin has to check each user manually if the license is still needed, there is no really cost optimization as the manual work also require time and cost at the end. Therefore, we’re looking for an automated way to solve this need. Luckily, there are REST APIs to support us! Let me walk you through the different steps and how a solution could look like.

What kind of information do we need?

To be able to tell who needs a license there are different information needed:

  • All users with a Power BI license
  • Last activity date for each user (like last log in, viewed report, etc.)
  • Decision how many days / months / years an user can be inactive and still keep a license

Once we got all users with a Power BI license, we can check with the last activity date and decide if the user still requires a license. In my case, I wish to remove the license if the user hasn’t had an activity in the last 90 days, but this can be adjusted based on your needs.

Prerequisites

As I love Python, I’m going to code in Notebooks and call REST APIs. The whole solution could also be done with PowerShell if you prefer this language more.

To get the needed details which user has what kind of license, we have to work with the Microsoft Graph API. Right now, there are two different versions: v1.0 and beta. As recommended by Microsoft documentation, I’m going to use the general available v1.0. Scrolling through the different options of the API, we’ll find the GET /users request which gives us all users in our Azure Active Directory (AAD).

Looking further, the API also offers to list all licenses an individual user has through the GET /users/{id}/licenseDetails where we have to provide the user ID. Combining those two APIs we’ll know which user have what kind of license.

As a next step, we’ll need the activity details as well. You can find a possible solution on my blog how to extract those details here.

Lastly, to be able to call the Graph API I would recommend setting up a Service Principal with the needed permissions. So, let me first walk you through this process.

How to set up a Service Principal for the Graph API

Head over to https://portal.azure.com and search for App registrations in the search bar at the top and select it.

Hit + New registration and give a recognizable name to your Service Principal (SP). In my case I’m going to name it “Power BI Guy Graph API”. As I wish to run the SP only in my directory, I choose the first account type in the list and let the redirect URI empty. Once done, I just hit the “Register” button.

After the SP is registered, we have to give the necessary API permissions. To do so, click on “API permissions” on the left-hand side and select + Add a permission.

Because I want to use the same SP to read all users and check licenses for each user, I’ll give the combined permission of both endpoints. To check which permissions are needed, check the Graph API documentation under the section “Permissions”. As we’re using a SP, we’re interested in the “Application” type of permission. Here’s an example of the list users API.

Heading back to the Service Principal, I choose “Microsoft Graph” at top after selecting the + Add a permission button. Because I want to run my app in the background, I choose the “Application permissions”. Once selected, I search for all listed permissions needed for the API. In this case, it’s User.Read.All, User.ReadWrite.All, Directory.Read.All, Directory.ReadWrite.All I just enter the needed permission in the search box and select it. Once all permissions are selected, I hit the Add permissions button.

After the permissions have been added, we have to grant admin consent to be able to call the API and read our necessary information.

When you grant tenant-wide admin consent to an application, you give the application access on behalf of the whole organization to the permissions requested. Granting admin consent on behalf of an organization is a sensitive operation, potentially allowing the application’s publisher access to significant portions of your organization’s data, or the permission to do highly privileged operations. Examples of such operations might be role management, full access to all mailboxes or all sites, and full user impersonation.

https://docs.microsoft.com/en-us/azure/active-directory/manage-apps/grant-admin-consent

Lastly, we have to create a secret (that’s like a password for our SP) to be able to log in with the SP. To do so, select Certificates & secrets on the left, select Client secrets, and hit the + New client secret. Give a recognizable description and an expires timeline. In my case I’ll use “PBI Guy: Read Users with Power BI licenses” and 6 months expiration.

Keep in mind your password will in this case expire after 6 months! Meaning you’ll need to recreate a secret or set up another expiration time.

Copy the Value of your secret now! Once you refresh / leave the page, the secret value will not be fully visible anymore and you would need to create a new one.

Now that we have our SP registered, let’s start the fun part with Python.

Get the job done with Python

As usual, we first have to import our needed libraries. In this case, following libraries are needed.

#Import necessary libraries

import msal
import requests
import json
import pandas as pd
from pyspark.sql.functions import *
from datetime import date, timedelta

You’ll probably notice that I work in the Azure Synapse environment to create and run my Python code. Obviously, you can choose your own environment but the benefits of using Synapse will come along this article!

In my next block of code, I set the needed variables. I start with the Service Principal ID or also called Client ID. This can be found in Azure Portal by selecting the newly created App and in the Overview screen, you’ll find the Client ID at the top.

The previously copied Secret Value is my next parameter. To get an access token, we have to specify the scope and authority URL as well. Scope in this case is set up to the Graph URL and the authority URL includes your tenant’s name at the end. Lastly, I define a Pandas DataFrame including all licenses SKUs with ID and Name in which I’m interested in. Because we’ll get all licenses back from each user through the Graph API and I’m only interested in the Power BI licenses, I want to specify and filter afterwards on those. Keep in mind that Power BI Pro is part of different SKUs like the E5 or A5. A full list of all SKUs including name and UID can be found here: https://docs.microsoft.com/en-us/azure/active-directory/enterprise-users/licensing-service-plan-reference

#Set parameters

client_id = '' #ID of Service Principal / App
client_secret = '' #Secret from Service Principal / App
scope = 'https://graph.microsoft.com/.default' #Defining Scope for Graph API
authority_url = "https://login.microsoftonline.com/..." #Defining authority / host

#Define all needed Power BI related SKUs
#All SKUs with the ID and friendly name of Microsoft can be found here: https://docs.microsoft.com/en-us/azure/active-directory/enterprise-users/licensing-service-plan-reference Check if new SKUs are available or have changed over time. The list below has been created on 15th September 2022
all_skus = pd.DataFrame ({
    'skuId': ['e97c048c-37a4-45fb-ab50-922fbf07a370', '46c119d4-0379-4a9d-85e4-97c66d3f909e', '06ebc4ee-1bb5-47dd-8120-11324bc54e06', 'c42b9cae-ea4f-4ab7-9717-81576235ccac', 'cd2925a3-5076-4233-8931-638a8c94f773', 'e2be619b-b125-455f-8660-fb503e431a5d', 'a4585165-0533-458a-97e3-c400570268c4', 'ee656612-49fa-43e5-b67e-cb1fdf7699df', 'c7df2760-2c81-4ef7-b578-5b5392b571df', 'e2767865-c3c9-4f09-9f99-6eee6eef861a', 'a403ebcc-fae0-4ca2-8c8c-7a907fd6c235', '7b26f5ab-a763-4c00-a1ac-f6c4b5506945', 'c1d032e0-5619-4761-9b5c-75b6831e1711', 'de376a03-6e5b-42ec-855f-093fb50b8ca5', 'f168a3fb-7bcf-4a27-98c3-c235ea4b78b4', 'f8a1db68-be16-40ed-86d5-cb42ce701560', '420af87e-8177-4146-a780-3786adaffbca', '3a6a908c-09c5-406a-8170-8ebb63c42882', 'f0612879-44ea-47fb-baf0-3d76d9235576'],
    'skuName': ['Microsoft 365 A5 for Faculty', 'Microsoft 365 A5 for Students', 'Microsoft 365 E5', 'Microsoft 365 E5 Developer (without Windows and Audio Conferencing)', 'Microsoft 365 E5 without Audio Conferencing', 'Microsoft 365 GCC G5', 'Office 365 A5 for Faculty', 'Office 365 A5 for Students', 'Office 365 E5', 'Power BI', 'Power BI (free)', 'Power BI Premium P1', 'Power BI Premium Per User', 'Power BI Premium Per User Add-On', 'Power BI Premium Per User Dept', 'Power BI Pro', 'Power BI Pro CE', 'Power BI Pro Dept', 'Power BI Pro for GCC']
})

You can of course adjust the all_skus DataFrame based on your needs.

As a next step, I want to log in with the SP and get an access token to work with and call the Graph API. To do so, I call the msal.ConfidentialClientApplication and provide the needed details. Afterwards, I store the access token in a result variable.

app = msal.ConfidentialClientApplication(client_id, authority=authority_url, client_credential=client_secret)
result = app.acquire_token_for_client(scopes=scope)

Next, I specify the Graph API to get all AAD users in a variable called url_get_all_users. Going further, I check if I got an access token and if so, I want to call the Graph API to get the needed details. If in any case I don’t get an access token, it also doesn’t make sense to call the Graph API as we’ll get a 403 error. Once the call succeeded, I store the result in a df_all_users DataFrame including only the needed columns “displayName”, “mail”, “userPrincipalName”, and “id”.

url_get_all_users = 'https://graph.microsoft.com/v1.0/users' #URL to get all AAD users

#If access token is created and received, call the get all users url to receive licenses per user
if 'access_token' in result:
    access_token = result['access_token']
    header = {'Content-Type':'application/x-www-form-urlencoded', 'Authorization':f'Bearer {access_token}'}

    api_call = requests.get(url=url_get_all_users, headers=header) #Effective get all users from AAD URL call

    result = api_call.json()['value'] #Get only the necessary child
    df_all_users = pd.DataFrame(result) #Convert to DataFrame
    df_all_users = df_all_users[['displayName', 'mail', 'userPrincipalName', 'id']] #Get only needed columns

As I have now all AAD users, I want to check which license each user has. To do so, I have to loop through all users in the df_all_users DataFrame and call the Graph API to get the license details. To be able to collect and store those details from each user into once, comprehensive DataFrame, I create an empty one before the loop.

In the loops itself I extract the current User ID, User Principal, and specify the Graph API URL for the current user in a separate variable. Afterwards, I call the API and store the result in a df_user_licenses DataFrame. To make sure I know which user is called, I expand the DataFrame with the User ID and User Principal info.

    df_all_user_licenses = pd.DataFrame() #Create empty DataFrame to store all users and assigned licenses

    for idx, row in df_all_users.iterrows(): #Iterate through each users from AAD
        user_id = row['id'] #Store the User ID in a separate variable
        userPrincipal = row['userPrincipalName']
        url_get_licenses = 'https://graph.microsoft.com/v1.0/users/' + user_id + '/licenseDetails' #Defining the URL to get licens per user

        api_call = requests.get(url=url_get_licenses, headers=header) #Effective get license per User URL call
        result = api_call.json()['value'] #Get only the necessary child

        df_user_licenses = pd.DataFrame(result) #convert to DataFrame
        df_user_licenses['userId'] = user_id #Add User ID to identify user
        df_user_licenses['userPrincipal'] = userPrincipal #Add User Principal to identify user

In the last piece of this block of code I want to filter down all licenses by user to only Power BI related ones. Because I get through ALL objects in AAD it could be that some of them don’t have a license assigned at all (like a room resource) and to avoid errors, I use the try and except trying to filter the result. Of course, you can do an if else statement as well to check if you have an empty result or even go other paths. In my case, I decided to go with the try and except. Once done, I add the filtered result into my comprehensive df_all_users_licenses DataFrame.

        #I'll use a try and except statement to handle empty requests --> if no license is assign nothing will be return and without try and except the script will run into an error. 
        #An if else statement would also work to check if the result is empty or not
        try:
            df_user_licenses = df_user_licenses[df_user_licenses['skuId'].isin(all_skus['skuId'])] #Get only PBI related SKUs
            df_user_licenses = df_user_licenses[['skuId', 'userId', 'userPrincipal']] #Get only needed columns
            df_user_licenses = all_skus.merge(df_user_licenses) #Using a join to retrieve only users with assigned PBI licenses
            df_all_user_licenses = pd.concat([df_all_user_licenses, df_user_licenses]) #Adding result to all user licenses DataFrame

        except:
            pass

My whole code looks now as following

Let me display the df_all_user_licenses DataFrame to check what we got until now.

As we see we got different users and the assigned licenses. In my screen shot we can see the Office 365 E5 and the Power BI (free) license assigned to some users.

So far, we have logged in via a Service Principal, got all users from AAD and the assigned licenses for each user. As a next step, we have to check the last activity date for each user. Here comes the superpower of Azure Synapse! As mentioned already, in one of my last blog posts I showed how I use Python to store Activity Logs in Azure Data Lake Gen2 – see https://pbi-guy.com/2022/03/10/power-bi-and-activity-logs-with-python/ I’m going to reuse this work and just read all the CSV files already stored with pySpark and store it into the df_activityLog DataFrame. Pay attention to “*” at the end of my path to read all CSV files, not only one.

#Read Activity Log folder with all files
df_activityLog = spark.read.load('abfss://powerbi@....dfs.core.windows.net/Activity Log/*', format='csv', header=True)

If you’re not sure how your abfss path should look like, head over to Data, Linked, select your container and folder where you’re log files are stored, right click on one file, and select New notebook – Load to DataFrame. Azure Synapse will create automatically a code to read your file with pySpark. Resue the path in your code.

My next step is to specify how many days back I want to check if some activity has happened in Power BI. In my case I go for the last 90 days and filter the df_activityLog DataFrame.

#Specify day varialbe for how many days you're looking back
daysBackToCheck = 90 #Configure this number based on need how many days you're looking for an inactive user. In this case 90 means 90 days going back from today on.
activityDays = date.today() - timedelta(days=daysBackToCheck)
activityDays = activityDays.strftime("%Y-%m-%d")

#Filter Activity logs to get last X days
df_activityLog = df_activityLog.filter(df_activityLog.CreationTime > activityDays)

As I’m not interested of what kind of activities have happened, I’ll just group my df_activityLog by UserID and get the max date out of it to see the last activity Date. Obviously, you could specify filters to check for specific activities like “View Report” or similar. But I decided to count every activity the same meaning as long as there is some kind of activity, the license is needed. To not mix things up, I rename the userId from the activity log to userPrincipal – which is more reliable and correct from my point of view. Last piece of the code is to convert the pySpark DataFrame to a Pandas DataFrame to be able to merge it afterwards easily.

#Aggregate to get the last activity day by user
df_activityLog = df_activityLog.groupBy('userId').agg(max('CreationTime').alias('Date'))
df_activityLog = df_activityLog.withColumnRenamed('userId', 'userPrincipal')

df_activityLog = df_activityLog.toPandas()

My whole code looks now as following.

Let’s display the result of df_activityLog as well.

As I’m using a demo environment, I don’t have much user activities on it. In the last 90 days, only 4 users have done something in my Power BI environment.

Now that I have all users with Power BI related licenses, and I have all users with some kind of activity, let’s merge those two DataFrames and check which users has a license but no activity in the last 90 days. To do so, I use the pd.merge and filter afterwards only users without a date as this means no activity has happend.

#Combine both DataFrames to check all users and their last login
df_combined = pd.merge(df_all_user_licenses, df_activityLog, how='left', on=['userPrincipal', 'userPrincipal'])

#Get all Users without login in last X days
df_combined_only_NaN = df_combined[pd.isna(df_combined['Date'])]

Let’s again display the df_combined_only_NaN DataFrame to check if we have some users with a Power BI related license but no activity.

As I’m doing this for demo purpose only, I will focus on removing Power BI Free licenses. Of course, there is no cost behind this license and in a real-world scenario I would focus especially on Power BI Pro (and probably Power BI Premium Per User), but the approach is absolutely the same, regardless which license you wish to remove. Therefore, I add an extra code block to filter down to only Power BI free licenses.

#Filter only to Power BI Free licenses for my demo use case
df_pbi_free = df_combined_only_NaN.loc[df_combined_only_NaN['skuId'] == 'a403ebcc-fae0-4ca2-8c8c-7a907fd6c235']

display(df_pbi_free)

If I now display all users with a PBI Free license, I see two users without an activity in the last 90 days in my case.

My last step is now to remove for those two users automatically the Power BI Free license. And again, the Graph API provides us with the right request. In this case, we need the POST /user/{id}/assignLicense request – see https://docs.microsoft.com/en-us/graph/api/user-assignlicense?view=graph-rest-1.0&tabs=http The documentation also highlights that a JSON body needs to be included looking like this.

{
  "addLicenses": [
    {
      "disabledPlans": [ "11b0131d-43c8-4bbb-b2c8-e80f9a50834a" ],
      "skuId": "45715bb8-13f9-4bf6-927f-ef96c102d394"
    }
  ],
  "removeLicenses": [ "bea13e0c-3828-4daa-a392-28af7ff61a0f" ]
}

One important detail is the content-type of the header. It has to be application/json so I start my code by adjusting the header variable. If wished, you can create another access token but in my case I’m going to reuse the already existing one.

#Overwrite header and reuse access token
header = {'Content-Type':'application/json', 'Authorization':f'Bearer {access_token}'}

Because the assignLicense request is per user, we have to create again a loop for each user for our df_pbi_free DataFrame. I extract again the user id, sku id, and the user principal in a separate variable to reuse it afterwards.

for idx, row in df_pbi_free.iterrows(): #Iterate through each users with a PBI Free license
    user_id = row['userId'] #Store the User ID in a separate variable
    sku_id = row['skuId'] #Store the SKU ID in a separate variable
    userPrincipal = row['userPrincipal']

My next step is to create the request URL and body. Once done, I can call the URL and remove the Power BI Free license for users.

    #configure URL to call to remove license from user
    url = 'https://graph.microsoft.com/v1.0/users/' + user_id + '/assignLicense'

    #create body with SKU ID
    body = {
        "addLicenses": [],
        "removeLicenses": [
            sku_id
        ]
    }

    #Call API to remove license
    api_call = requests.post(url=url, headers=header, json=body)

Making sure my call was successful, I print a message at the end depending on the returned status from the API (200 means successful, everything else is an error in my case).

    if api_call.status_code == 200:
        print('License has been successfully removed from user', userPrincipal)

    else:
        print('An error occured and license has NOT been removed')

My whole code looks now as following.

Before I run the code, let’s check manually if Adele and Alex really have a Power BI Free license in the Azure Portal. To do so, I go to the Azure Portal, search for users, and select each user. Once selected, I click on Licenses and check if Power BI Free is assigned. In both cases the answer is yes.

Now let’s run the code and see what will happen. After the code run successfully, I got following message.

It looks like it was successful. Let’s check manually by going back to the Azure Portal and refresh the view of Adele.

How great is this! We just removed the license automatically! This means we can really automate for which user licenses should be removed. In my demo case, I used the Power BI Free license to remove. But obviously this approach could also be used to remove other licenses like Power BI Pro, E5, and many others (depending on your needs and activity logs).

Please let me know if this post was helpful and give me some feedback. Also feel free to contact me if you have any questions.

If you’re interested in the files used in this blog check out my GitHub repo https://github.com/PBI-Guy/blog

The Power BI Championship Switzerland

For the first time in Switzerland, we organized the Power BI Championship which crowned the top 3 teams based on their solution. In this post I’m going to share what the Championship is all about, what the challenge was (feel free to challenge yourself and create a report on your own), and how the jury scored all the amazing solutions we got. Lastly, I’m going to share the Top “10” solutions in the GitHub repo so everyone can get inspired about the different ideas and solutions.

What is the Power BI Championship

The whole idea of the Championship was to enable everyone to work with Power BI and get to see what’s possible within just a few days. We organized a Briefing Session on the 20th of May 2022 to explain everyone who registered how the Championship will look like and how – even if you’re a new enthusiast – you can skill yourself during the upcoming days and weeks. Starting from the 20th we posted every day for the upcoming two weeks a new enablement Guy in a Cube video to make sure you know the basics about Power BI and how to create reports. (See All Enablement Videos from Guy in a Cube down below).

On the 2nd of June we finally had our Kick-Off where we introduced the Dataset which all Champions have to use. We gave each individual and team the choice between the GHO OData API (https://www.who.int/data/gho/info/gho-odata-api) and the Swiss Open Data about rent prices (https://opendata.swiss/en/dataset/durchschnittlicher-mietpreis-pro-m2-in-franken-nach-zimmerzahl-und-kanton2). The goal was to use at least one of these two datasets and create a report on top. Everyone was free to add more, publicly available data to enhance the report and provide a solution until midnight 7th of June.

Once all teams have submitted their solution a jury of three technical Microsoft FTEs went through the PBIX files to score the solution based on a scoring system. This made sure scoring was as objective as possible and the winner was really determined based on neutral criteria, not personal preferences. All three jury members scored different aspects of each report and the average was taken as final points, e.g. How is the Layout? How is the Data Model? Did the team follow Best Practices? Are all columns / tables from the Data Model used? How is DAX structured? How complex is the DAX used? Did they think about a mobile layout? And so on. Nevertheless, some criteria are still more important than others. Therefore, we decided to weight the different categories. An overview can be found in the image below.

The main idea was to determine a Top 10, announce them on the 10th of June, and invite them to the Finals on the 17th of June. But there was one “issue” – the different solutions have been so amazing and the scoring so close we just couldn’t do a hard cut and invite only the Top 10! We decided during the scoring that we invite even the Top 14 plus 3 Golden Buzzers to the Finals! Golden Buzzer in this case means that each jury member had a Golden Buzzer to vote for a solution once to see them in the Finals regardless of their score. This way we had 17 great teams presenting their solution on the 17th of June.

Once the teams have been announced they had seven days to prepare for the live demo and also collect some extra points through LinkedIn. This means each team had to collect Likes, Comments, and Shares to score more points at the end. Idea behind this was to check if others also like the team’s solution or was it only the jury. But again, we wanted to make sure that just because someone had a huge LinkedIn community, they will not win based on this. So, we weighted again all Teams. The team with the most Likes, Comments, and Shares got 10 points, the second best got 9 points, etc.

Lastly each Team had to sell their solution to the jury who represented a CEO, CIO, and CMO within a 10min live demo. Again, all teams have been scored and weighted (best team 10 points, second best team 9 points, etc.) to make it as fair as possible.

In a last step, we weighted each score (Solution Score 70%, Social Media Score 10%, Live Demo 20%) to determine the Top 3.

This is just an example and not the real scoring during the Championship

Based on these criteria, the winners of the Power BI Championship Switzerland 2022 are:

1st Place: Team BIdventure, Members: Karim Abdrakhmanov & Anthony Haberli
2nd Place: Team Clouds on Mars, Members: Greg Stryjczak & Wojtek Bak
3rd Place: Pascal Kiefer

I want to highlight one more time that this doesn’t mean the other solutions haven’t been good – contrary! All finalists have delivered awesome and outstanding reports and it made the jury’s life really hard to have “only three winners”! But the small details in the end decided the scoring – like a Championship should be. If you’re interested in how close it really was, check the GitHub repo with all the final solutions and write in the comments which was your favorite one.

All Enablement Videos from Guy in a Cube

Please let me know if this post was helpful and give me some feedback. Also feel free to contact me if you have any questions.

If you’re interested in the files used in this blog check out my GitHub repo https://github.com/PBI-Guy/blog

Power BI and Activity Logs with Python

One of the most asked questions when I talk with Power BI Admins / Service Owners is how can they analyze which reports are (most) used. Power BI respectively Microsoft offers you different ways to get such insights. In this blog post I’ll give you an overview of the different ways and walk you through how to leverage the Power BI Admin REST API with Python to extract log files and analyze them – obviously – with Power BI.

What’s available

Here is a quick overview of different ways to get an usage metric of one or multiple reports.

  • Usage Metrics
  • M365 Audit Logs
  • Power BI & Azure Log Analytics
  • Power BI & PowerShell
  • Power BI REST API

Let’s explore them in more details. First of all the Usage Metrics which is out-of-the-box available in Power BI Service. As of this writing we differentiate between the classic workspace and new workspace Monitor Usage. Both of them gives you insights about the usage of your report. For example you can see how many views, unique viewers, and viewers per day for the specific report. Further, you could edit the report and delete the filter to get an overview of all reports within the same workspace. Unfortunately it’s not possible to have one Usage Metrics report across different workspaces this way which is therefore not the best solution for admins to get a total overview. Lastly, the Usage Metrics gives you an overview of the last 90 days, not more.

Going further with M365 Audit Logs. Each user, who have View-Only Audit Logs, Audit Logs, Global Admins, and/or Auditors permissions, have access to the general M365 Audit Log files. Power BI, like any other M365 service, logs all kind of different activities in the M365 Audit Log for the last 90 days. Therefore you can go the the M365 Compliance Center – Audit and search on different Activities. In the screen shot below I’m searching for Viewed Power BI report and get a result per Date and Time of the different Reports users have accessed (viewed). If wished I can download the result as CSV.

As nice as this possibility is there are two pain points from my point of view. First, if I have the sufficient rights to access the Log Files I have access to every log entry from any other M365 Service as well (e.g. SharePoint Online, Exchange Online, Dynamics 365, etc.), not only Power BI. Secondly, it’s a manual process. As Patrick from Guy in the Cube says: I’m not lazy, I’m efficient. And every manuel process is not really efficient. Therefore let’s explore the other ways, probably we find a better solution.

Since June 2021 you can connect an Azure Log Analytics Workspace with a Power BI Workspace to store automatically activity information. The beauty of this way is that once set up, you don’t have to run any kind of script or do something manually as everything is automatically saved in Azure Log Analytics. Further, it’s just storing Power BI related data and you don’t have access to other Microsoft Services logs. The downside is that Power BI Premium (per Use) and Azure Log Analytics is required, which can increase your costs. Costs for Log Analytics are, from my point of view, not that high. It starts already at $2.76 per GB but still it has to be considered. Prices for Azure Log Analytics can be found here. Another limitation (as of writing this post) is, that you can connect only one Power BI Workspace with one Azure Log Analytics workspace meaning you would need to create one Azure Log Workspaces per Power BI Workspace to store the log data. Of course you can combine it afterwards in Power BI or other tools but it’s still not on one central place. How to use and set up Azure Log Analytics with Power BI can be found here.

Moving on to the next possibility of using PowerShell to extract the log files. Instead of manually extracting the Log File in the Microsoft Compliance Center, as seen above, you can also create a PowerShell script to automatically get the needed data. Microsoft offers a good documentation (see here) how to use it and what’s required. One important thing to keep in mind is that you have two different cmdlet to get your data. One is the Power BI Activity Event (Get-PowerBIActivityEvent) and the other is the Unified Audit Log (Search-UnifiedAuditLog). The first one will give you only Power BI-related data for the last 30 days while the Unified Audit Log will give you access to the whole audit log for the last 90 days. This means you could also get data from other Microsoft Services, not only Power BI. Therefore you’ll find a filter option with the Unified Audit Log to get only Power BI related data (see screen shot below, marked with a red line).

I tested successfully the Unified Audit Log cmdlet as you can see below. I extract one file for the last 90 days in this example but of course you can extract only one day and run the script on a daily basis to get a history of your data (see line #20 in script) The whole script is of course in my GitHub repo.

The best part of this approach is that you can specify what exactly you wish to export – not only Power BI related logs. Further if you’re exporting it on your own you can choose how to store the data (CSV, Excel, Database, etc.) and create a historization. But like with manually extracting the log files you would require sufficient permissions. If you would use the Power BI Activity Log (Get-PowerBIActivityEvent) you won’t have access to the whole log file and you would only require Power BI Admin, Power Platform Admin, or Global Admin rights. And of course you would require some tech skills for this approach to create and use a PowerShell script but even myself with some guidance from Bing and YouTube could create such a script to extract the data and store it as CSV file. 🙂

Lastly, if you’re more familiar working with REST APIs the last option would be your preferred way. As in the document stated Power BI offers a REST API to get Activity Events. Let me walk you through how you can leverage the API with Python and store the data into an Azure Data Lake Gen2 to analyze it afterwards with Power BI.

Requirements

  • Create / Use a Service Principal
  • Enable Service Principals rad-only access to Power BI admin API in Tenant Settings
  • Azure Data Lake Gen2
  • Python Skills
  • Understanding REST APIs

First of all let’s make sure we have the sufficient permission to run our Python script. Because I wish to automate it and I don’t wish to use my personal account I’ll need a Service Principal. How to register an App / create a Service Principal can be found in this guide. But let me walk you through as well. Log in into your Azure Portal, search for “App Registration” and hit “New Registration”. Give your app a name and select the supported account type (I choose the first option, only Single Tenant). In my case I called my Service Principal “Power BI REST API”.

Note: No API permissions are required as the application’s Azure AD permissions will have no effect. The application’s permissions are then managed through the Power BI admin portal.

Afterwards I created a Security Group called Power BI REST API and added my Service Principal to the group.

Next, we have to make sure that Power BI in general allows Service Principals to use the Power BI Admin REST API. To do so I log in to Power BI, go to the Admin Portal and Enable in the Admin API Settings the necessary feature. Once enabled I add my Power BI REST API Security Group.

Now that we’re ready and have the sufficient permission let’s create our Python script. I’ll do so in the Azure Synapse environment but of course it would also work in any other tool like Visual Studio Code.

As usual with Python let’s import the needed libraries first. In this case we need following libraries:

  • msal
    This is the Microsoft Authentication Library which we use to authenticate against Power BI.
  • requests
    I’m using the requests library to send my REST API requests.
  • json
    Because the result from the REST API is a JSON format I’m using this library to read the result.
  • pandas
    With this library it’s very easy to create tables (dataframes) and store them afterwards.
  • date & timedelta from datetime
    I need the current date to be able to automate my script and run it on a daily base.
#Import necessary libraries
import msal
import requests
import json
import pandas as pd
from datetime import date, timedelta

Afterwards let’s parametrize our script. First thing, let’s get yesterdays date. Because I want to run the script in the morning, it doesn’t make sense to use the current date as not much have happened. Therefore I’m focusing on the day before with following code:

#Get yesterdays date and convert to string
activityDate = date.today() - timedelta(days=1)
activityDate = activityDate.strftime("%Y-%m-%d")

I’m converting the date into a string in the format of YYYY-MM-DD which is required for the REST API call. Our next step is to make sure we can authenticate with our Service Principal. For that we need the Client ID, Client Secret, Authority URL, and the Scope. If you head over to the Azure Portal where the Service Principal was created (Search for “App Registration”) you’ll find the Client ID in the Overview pane.

To create a Client Secret hit the Certification & Secrets tab and choose New client secret. Configure and add a description and wished. Once created make sure to copy the value because afterwards it won’t be visible anymore and you would need to create a new secret.

For the Authority URL please us https://login.microsoftonline.com/ adding your tenant name at the end. In my case it’s kbubalo.com. Lastly we need the scope which is https://analysis.windows.net/powerbi/api/.default

#Set Client ID and Secret for Service Principal
client_id = ""
client_secret = ""
authority_url = "https://login.microsoftonline.com/kbubalo.com"
scope = ["https://analysis.windows.net/powerbi/api/.default"]

Now let’s set up the REST API URL which we’re calling to get our Activity Data. Looking at the doc here or in the Power BI Admin REST API doc here we see the main request is GET https://api.powerbi.com/v1.0/myorg/admin/activityevents following with the start and end datetime parameter. Because we parametrized our start and end date my URL parameter in Python looks as following:

#Set Power BI REST API to get Activities for today
url = "https://api.powerbi.com/v1.0/myorg/admin/activityevents?startDateTime='" + activityDate + "T00:00:00'&endDateTime='" + activityDate + "T23:59:59'"

As you see we’re adding the time at the start and end date to get the whole day.

Lastly we specify one more parameter for my CSV path where we wish to store the file.

#Set CSV path
path = 'abfss://powerbi@aiadadlgen2.dfs.core.windows.net/Activity Log/'

Now that we parametrized everything that we need let’s create our Python code. First thing to do is to authenticate against the Power BI Service to make sure we can call the REST API. Therefore I’m using the msal and my parameters to authenticate and store the result into a result parameter.

#Use MSAL to grab token
app = msal.ConfidentialClientApplication(client_id, authority=authority_url, client_credential=client_secret)
result = app.acquire_token_for_client(scopes=scope)

If we receive and access token, we would like to proceed calling our Power BI REST API. From the result we have to extract the access token, which will be used to call the REST API, and specify the header. Once done, we can call the REST API URL specified above with the requests.get method.

#Get latest Power BI Activities
if 'access_token' in result:
    access_token = result['access_token']
    header = {'Content-Type':'application/json', 'Authorization':f'Bearer {access_token}'}
    api_call = requests.get(url=url, headers=header)

Reading the doc it says following:

Microsoft Doc

If the number of entries is large, the ActivityEvents API returns only around 5,000 to 10,000 entries and a continuation token. Call the ActivityEvents API again with the continuation token to get the next batch of entries, and so forth, until you’ve gotten all entries and no longer receive a continuation token. The following example shows how to use the continuation token. No matter how many entries are returned, if the results include a continuation token, make sure you call the API again using that token to get the rest of the data, until a continuation token is no longer returned. It’s possible for a call to return a continuation token without any event entries. […]

Therefore we have to call the continuation URL as long as one is given and we wish to store the already called data of course to not lose them. Because of that we create an empty Pandas Dataframe in which we can append our results from each call. Further we store the continuation URL into a parameter and the first result into a second data Dataframe which we append to our empty one. Afterwards we have to do a while loop until no continuation URL is available anymore. Obviously we need to store from each call again our result into a Dataframe and append it to our first (now not empty anymore) Dataframe. Lastly we specify as Dataframe Index the Id URL.

    #Specify empty Dataframe with all columns
    column_names = ['Id', 'RecordType', 'CreationTime', 'Operation', 'OrganizationId', 'UserType', 'UserKey', 'Workload', 'UserId', 'ClientIP', 'UserAgent', 'Activity', 'IsSuccess', 'RequestId', 'ActivityId', 'ItemName', 'WorkSpaceName', 'DatasetName', 'ReportName', 'WorkspaceId', 'ObjectId', 'DatasetId', 'ReportId', 'ReportType', 'DistributionMethod', 'ConsumptionMethod']
    df = pd.DataFrame(columns=column_names)

    #Set continuation URL
    contUrl = api_call.json()['continuationUri']
    
    #Get all Activities for first hour, save to dataframe (df1) and append to empty created df
    result = api_call.json()['activityEventEntities']
    df1 = pd.DataFrame(result)
    pd.concat([df, df1])

    #Call Continuation URL as long as results get one back to get all activities through the day
    while contUrl is not None:        
        api_call_cont = requests.get(url=contUrl, headers=header)
        contUrl = api_call_cont.json()['continuationUri']
        result = api_call_cont.json()['activityEventEntities']
        df2 = pd.DataFrame(result)
        df = pd.concat([df, df2])
    
    #Set ID as Index of df
    df = df.set_index('Id')

Side note: During the creation of the Python Code I called the REST API for test purpose to make sure it works. During the test phase I received a result with all the columns. That’s the reason why I know which columns and in which order I have to create the empty Dataframe.

Our last step is to save our Dataframe into our ADL Gen2. This is very simple with Pandas Dataframe:

    #Save df as CSV
    df.to_csv(path + activityDate + '.csv')

Make sure to add “.csv” at the end to have the proper file type.

That’s it! Our whole code is done. Let me copy it for you so you have for sure the whole code in proper order.

#Import necessary libraries
import msal
import requests
import json
import pandas as pd
from datetime import date, timedelta

#Set parameters

#Get yesterdays date and convert to string
activityDate = date.today() - timedelta(days=1)
activityDate = activityDate.strftime("%Y-%m-%d")

#Set Client ID and Secret for Service Principal
client_id = ""
client_secret = ""
authority_url = "https://login.microsoftonline.com/kbubalo.com"
scope = ["https://analysis.windows.net/powerbi/api/.default"]

#Set Power BI REST API to get Activities for today
url = "https://api.powerbi.com/v1.0/myorg/admin/activityevents?startDateTime='" + activityDate + "T00:00:00'&endDateTime='" + activityDate + "T23:59:59'"

#Set CSV path
path = 'abfss://powerbi@aiadadlgen2.dfs.core.windows.net/Activity Log/'

#Use MSAL to grab token
app = msal.ConfidentialClientApplication(client_id, authority=authority_url, client_credential=client_secret)
result = app.acquire_token_for_client(scopes=scope)

#Get latest Power BI Activities
if 'access_token' in result:
    access_token = result['access_token']
    header = {'Content-Type':'application/json', 'Authorization':f'Bearer {access_token}'}
    api_call = requests.get(url=url, headers=header)

    #Specify empty Dataframe with all columns
    column_names = ['Id', 'RecordType', 'CreationTime', 'Operation', 'OrganizationId', 'UserType', 'UserKey', 'Workload', 'UserId', 'ClientIP', 'UserAgent', 'Activity', 'IsSuccess', 'RequestId', 'ActivityId', 'ItemName', 'WorkSpaceName', 'DatasetName', 'ReportName', 'WorkspaceId', 'ObjectId', 'DatasetId', 'ReportId', 'ReportType', 'DistributionMethod', 'ConsumptionMethod']
    df = pd.DataFrame(columns=column_names)

    #Set continuation URL
    contUrl = api_call.json()['continuationUri']
    
    #Get all Activities for first hour, save to dataframe (df1) and append to empty created df
    result = api_call.json()['activityEventEntities']
    df1 = pd.DataFrame(result)
    pd.concat([df, df1])

    #Call Continuation URL as long as results get one back to get all activities through the day
    while contUrl is not None:        
        api_call_cont = requests.get(url=contUrl, headers=header)
        contUrl = api_call_cont.json()['continuationUri']
        result = api_call_cont.json()['activityEventEntities']
        df2 = pd.DataFrame(result)
        df = pd.concat([df, df2])
    
    #Set ID as Index of df
    df = df.set_index('Id')

    #Save df as CSV
    df.to_csv(path + activityDate + '.csv')

Let’s test our script by executing it. Once finished I see that a CSV file is stored in my ADL Gen2 – awesome! Now I can automate it in Azure Synapse through a Azure Data Factory Pipeline and run it on a daily base. After a while I see multiple files, one for each day.

Let’s quickly test the result by querying the CSV files through Serverless SQL built-in Azure Synapse (yes, that’s possible!)

Great, we have some data with different Activities!

In my next post I’ll walk you through how to create a Power BI Report on top to analyze the different log files at once – stay tuned!

Please let me know if this post was helpful and give me some feedback. Also feel free to contact me if you have any questions.

If you’re interested in the files used in this blog check out my GitHub repo https://github.com/PBI-Guy/blog

Multilingual Reports in Power BI

Creating Power BI reports in Switzerland can be challenging when it comes to the question: In which language should we display the report? The reason behind is that Switzerland has 4 official languages and if we consider English, it’s even 5. Therefore it’s not easy to fulfill this requirement with one report – or is it? Let me walk you through different scenarios how you can create multilingual reports with Power BI.

Possible Solutions

As in most scenarios in Power BI there are different ways to achieve the same goal. Therefore let me list some solutions:

  • Create a separate report for each language
  • Create one report and translate data through a service (like Azure Cognitive Services)
  • Create a Datasets for each language
  • Create a report, use a “translation table”, and work with bookmarks
  • Create one report and a “translation table” to display the right language

Of course each scenario has his pros and cons so let me go through some of them quickly and focus afterwards on the main solutions I’m going to present in this post.

Create a separate report for each language

Creating a separate report for each language is from my point of view a maintenance nightmare. Imagine having 5 different languages, therefore having 5 “different” reports (which all look the same but using only a different language), and now you have to customize a visual. Not only you have to do the work multiple times, you have to do it every time a modification is required! Besides that you have to keep an overview which users has access to which report making sure they have access to the right language. Therefore I wouldn’t recommend to go this path and look into other ways to fulfill the multilingual report requirement.

Create one report and translate data through a service

Using a Service to translate your data is a nice and handy solution. The good side of this approach is that you do not have to create your own translation for each word and sentence for each language. This can be done automatically through an API. On the other hand the translation itself could lead to unexpected results, sentences could be translated in a wrong or misleading way which can cause other, unexpected issues which could be avoided in the first place. Therefore it’s not a perfect solution but for sure one worth trying if you do not have a “translation table” which can be used. If you’re interested in how to call an API to translate your data let me know and I’ll be happy to post about it in future.

Create a Datasets for each language

Chris Webb wrote a great article (see https://blog.crossjoin.co.uk/2021/02/21/implementing-data-as-well-as-metadata-translations-in-power-bi) how you can create multiple Datasets – one for each language – and use the DirectQuery Mode (not Live Connection! 😉 ) to connect to the needed Dataset. This approach has also his benefits as the data and meta data like column name and title can be translated. On the other hand it’s again a maintenance effort for all the different Datasets and PBIX files.

Create a report, use a “translation table”, and work with bookmarks

I saw a post from Greg Philips how you can handle Multilingual Reports with a translation table and multiple pages and bookmarks. Everything is described here: https://blog.enterprisedna.co/create-a-multilingual-power-bi-report/

This solution gives you the full flexibility to translate data, columns, titles, etc. in your report. On the other hand you would need to create a separate page for each language and maintain the bookmarks on top of it. If changes will occur you would need to change it on every page. Still better than having multiple reports, but could lead to a lot of maintenance hours. Nevertheless it’s a really nice solution to work with different languages in one report.

Create one report and a “translation table” to display the right language

Another approach is to have a “translation table” within Power BI which is used to translate the needed data in the right language. Let me walk you through how this could look like in Power BI.

As an example imagine we have a table with some fruits, numbers, and an ID for each fruit. Further we have a second table with the fruit ID, display language, and the translated value.

Once in Power BI imported you can create a relationship between the two tables through the ID if that’s not already automatically done during the import process.

As a next step you can add a Slicer Visual using the Language column from the Language table and add a Table Visual with the Number Column from the Fruits table and Value Column from the Language table.

If you select now a language in the slicer the Table Visual will filter it to the selected language. You can even force a selection through the slicer in the settings by turning on “Single select”.

To enhance this solution and apply automatically the correct language you can even build a third table matching the language with an user and use RLS to apply the right language. In my simple solution I created following table.

Tip: I blogged about RLS a while ago and if you’re interested in how to implement it check it out here: https://pbi-guy.com/tag/row-level-security/

As you can see the table contains the language, name and UPN of each user. Once in Power BI imported create a relationship between the language column from the User Language table and the Language column from the Language table. Our whole relationship model looks now as following.

Our next step is to create a role and set a rule so users can only see their specific language. We’re going to user the USERPRINCIPALNAME() to identify which user is logged in and match the mail address with the User Language table.

Once this is set up the Slicer Visual is not needed anymore as through RLS the data is already filtered. I just added a card visual showing the current language and the USERPRINCIPALNAME (I created a DAX measure for this). If we test now RLS on behalf of another user – let’s take Luke – we see following.

If we change it to Chewbacca the language will apply automatically.

This approach is very good if you do not have a lot of data and languages. As you can imagine if you add a new fruit your language table will need three more lines for the three languages in this case. If you add a new language your language table will increase even more which leads to a bigger data model size in both cases. Further performance can decrease due to the implemented RLS rule. On the other side user experience can increase as the language will automatically apply but users can’t change it on their own if RLS is in place (e.g. in my personal case I prefer to display everything in English even if I’m based in the German-speaking part of Switzerland).

Besides data translation Power BI offers ways to translate field and table names automatically as well. Let me show you how to add different languages into your model.

Translate Power BI field and table names

To be able to add multiple languages into your model you’ll need to work with third-party tools. This could be Visual Studio, Tabular Editor, or anything else that can handle and configure a tabular model. In my case I like to work with Tabular Editor because as soon as you install it you’ll have it integrated in Power BI Desktop to open it directly from the ribbon connected to your model.

Once opened you’ll find a “Translations” folder in your model. Right-click on it and hit New Translation.

A new window will pop-up where you can choose which culture you wish to add. In my case I select de-DE and hit OK. This means once translations are implemented in de-DE language Power BI will recognize the Browser or Power BI Desktop Language Settings and display automatically the translation of my tables and columns in this language.

You’ll notice how the Translation folder has now two different languages. In my case en-US and de-DE. Now I can expand the Tables folder, select a table or column, scroll down to Translated Names Properties and add for each language a translation. As you can see in my example below I choose the table Fruits and translated it to Früchte in German.

To make the translation easier Chris Webb has a very useful and easy-to-use tool which is available for free here: https://www.sqlbi.com/tools/ssas-tabular-translator. To be able to use it export the translations as json file and import it afterwards by right-clicking on the Translations folder in your model.

Once everything is translated as wished save your model and publish the report to Power BI Service. In there you have to change the browser language or choose through Power BI settings your preferred language and your table and column names will be display accordingly. If you wish to test in in Power BI Desktop keep in mind that since March 2021 release Power BI Desktop will not reflect the model translations so you would need to have an earlier version if you wish to do so.

Edit: Further keep in mind that this works only with Premium. Therefore you’ll need Power BI Premium, Premium per User, or an Embedded capacity.

Please let me know if this post was helpful and give me some feedback. Also feel free to contact me if you have any questions.

If you’re interested in the files used in this blog check out my GitHub repo https://github.com/PBI-Guy/blog

Power BI Object-Level-Security

Many users are aware that Power BI offers Row-Level-Security to secure their data. As example you can use RLS so users from a specific country can only see the sales numbers from this country and not others. I did already a blog post about the different possibilities (see https://pbi-guy.com/2021/10/12/power-bi-row-level-security/ & https://pbi-guy.com/2021/10/15/power-bi-row-level-security-organizational-hierarchy/ & https://pbi-guy.com/2021/10/15/power-bi-rls-configuration-in-service/). But many customers don’t only want to secure on a row-base they also want to secure their data on a “column-” or “table-base”. And exactly for this purpose Power BI offers Object-Level-Security. Let me walk you through how to set up OLS in Power BI.

Prerequisites

  • Power BI Desktop
  • Power BI Service Account
  • Tabular Editor

How to

To enable OLS we start in Power BI and create first a data model. I’m going to use my standard Sales Report with Wide World Importers sample data. Further I created three visuals with Text boxes to show the different OLS options – No OLS applied, only on one specific column (customer), and on the whole table (dimEmployee). Every visual shows the Profit by different dimension. First one by Sales Territory, second one by Buying Group, and the third one by Employee.

As a next step we have to create the different Roles so OLS can be applied to it. Go to the Modeling Tab in the Ribbon and select Manage Roles.

In here I created two different roles – one where only the OLS for the column Customer should be applied and one where the whole Table dimEmployee should be secured. No DAX expression or anything else is needed – just the two empty roles. Once done hit the Save button.

After the test page and the roles are set up I connect to my model with Tabular Editor by selecting it through the ribbon External Tools.

Pro Tip: If you open Tabular Editor directly from Power BI Desktop you’ll be automatically connected to your data model.

Once Tabular Editor has opened you should see a similar screen like the below.

As a next step I expand the Roles and select first the “OLS on Table dimEmployee”. Once the role is selected in the property pane you see a property “Table Permissions” in the “Security” section. Expand it and configure “None” to the table which should be secured. In our case it’s dimEmployee. This means that every user who will be added to the “OLS on Table dimEmployee” role afterwards will not see any data coming from the dimEmployee table.

Now I select the other role and instead of “None” I set the dimCustomer Table to “Read”. The reason is we just want to secure one specific column and not the whole table. Therefore the table can be read in general but we have to configure specific columns which should be secured. After you set the dimCustomer table to read the role can be expanded on the left hand side which lists all tables in “Read” or “None” mode.

Next select the dimTable below the role, head over to “OLS Column Permissions” under “Security” in the property pane and set the column “Customer” to “None”. Every other column will use the Default behavior of the table which is “Read”.

After we set up everything now in Tabular Editor we can save our model and close Tabular Editor. Back in Power BI Desktop let’s test our roles. First I test the “OLS on Table dimEmployee” role by going to Modeling – View as – selecting OLS on Table dimEmployee – and hit OK.

We see that our OLS works because the right hand visual is not showing anything. Further the whole table dimCustomer is also not visible.

That’s exactly what we expected – great! Let’s test the second role. After we switched the view every visual is showing up but the “Customer” field in the table “dimCustomer” is hidden. This is also expected as we’re not using the Customer field in our report so far therefore everything can be shown.

Let’s turn of the role view and replace the “Buying Group” column with “Customer”.

Than we enable the role view again to see if security applies.

And as we can see yes it does! Because the visual is using the column Customer now it’s not showing up.

As a last step you would need to publish the report to the Service and assign user / groups to the desired role. One user / group can also be added to multiple roles if needed like with RLS.

Personally, I find the OLS very useful to secure your data model but the message which appears to end user is not very user friendly. I would love to see an update here which says at least it’s secured instead of “Something went wrong” because as an admin it’s expected behavior and not wrong. Best option would be if I could configure the message as I wish.

Please let me know if this post was helpful and give me some feedback. Also feel free to contact me if you have any questions.

If you’re interested in the files used in this blog check out my GitHub repo https://github.com/PBI-Guy/blog