How to extract data from the Fabric Metrics App – Part 1

In recent discussions with my customers about Microsoft Fabric, the questions pops up how to create an internal and fair charge-back mechanism. There are different possibilities, from user-based, item-based, or usage-based scenarios, which you can leverage. From my point of view, the usage-based model would be the fairest one. In such a scenario, creators of items are eager to optimize their workload to reduce the usage on a capacity and therefore save some cost. But how can you create such a charge-back report? Let me walk you through in a this blog post how to set the basics and in my next one how a possible solution can look like.

Prerequisites

To be able to collect the necessary data and create a charge-back report, we will need some tools and items.

Let’s get started

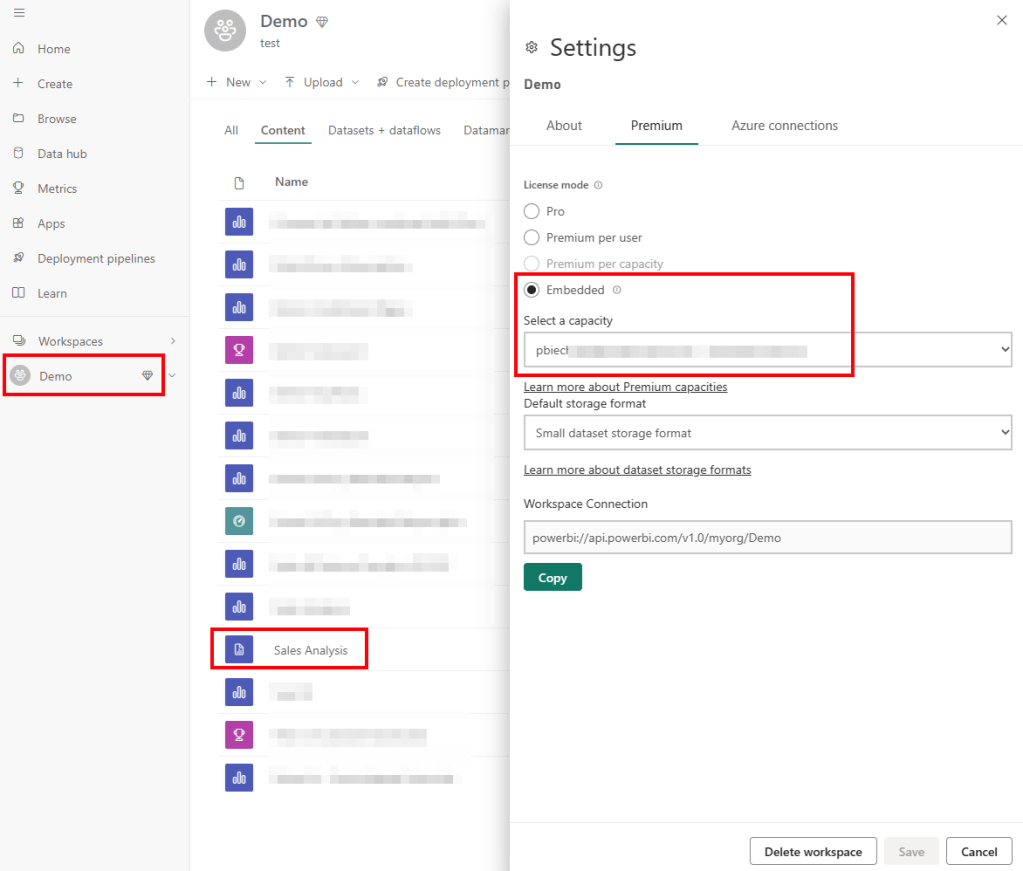
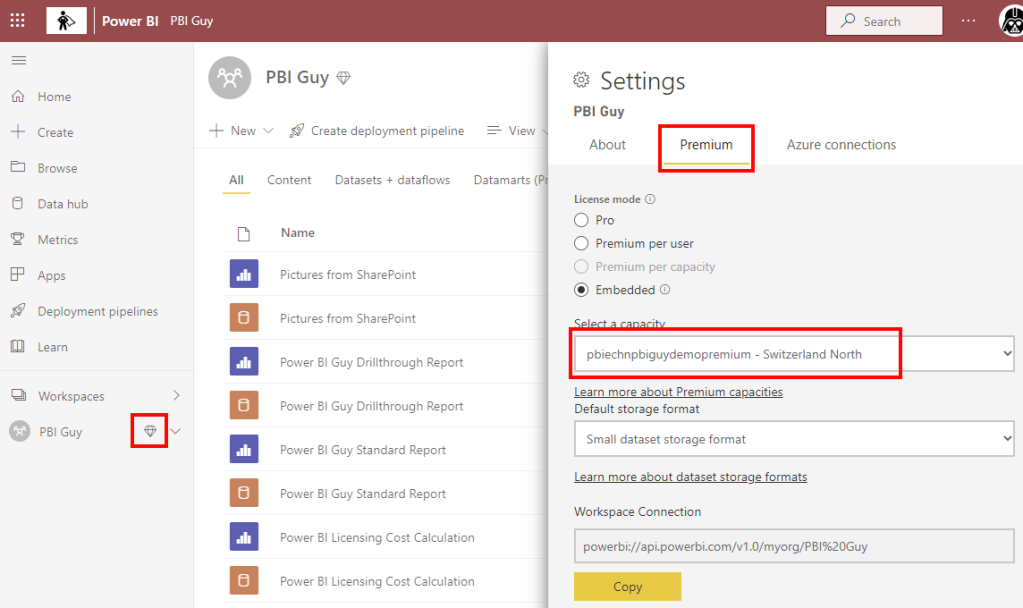
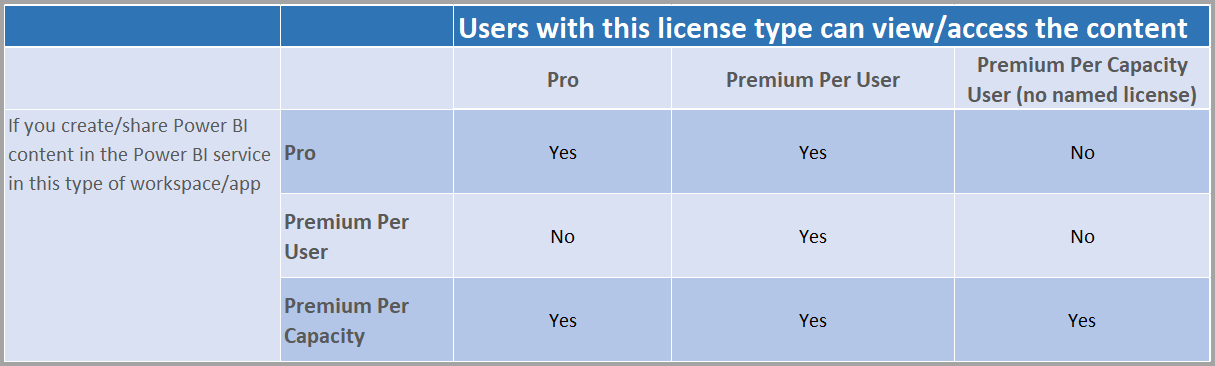
The Fabric Capacity Metrics App is the best way to get an overview of who created how much load with which items on your capacity. The Microsoft documentation shows how easy it is to install and use it. Once installed, I switch to the Workspace called Microsoft Fabric Capacity Metrics and change the workspace settings to assign a capacity to the workspace. In my case, I use a Fabric one but a Premium, Premium per User, or Embedded would work as well.

Once done, I refresh the Semantic Model and open the report afterwards. Now, I have already an overview of the usage of the last 14 days. I would be able to filter now for example on a specific day to see what kind of items have produced how much load. But as I wish to have in detail who created the load, I need to drill-down to a specific data point. For that, I select on the top right visual a data point and hit the Explore button.

On the next page, I have a good overview of all interactive and background operations that have happened on my capacity (the two table visuals in the middle). If you’re interested in what kind of operations are considered as interactive resp. background, feel free to check the Microsoft documentation.

The issue right now is that on one hand we have only the last 14 days data and usually a monthly charge-back report is needed. An on the other hand, the details are only per Timepoint, which is a 30 second interval, available. Therefore, I need to extract the data to have a longer history and do that for each timepoint of the day. Let me start with extracting the data first.

Capture the DAX statement

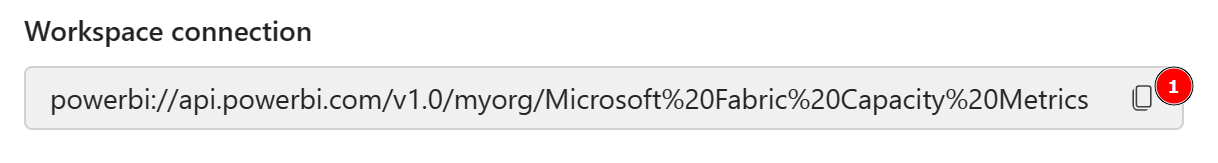
I could connect with DAX Studio to the Semantic Model as the workspace is sitting now in a capacity and try to write my own DAX statement to get the required details. But as I’m efficient (not lazy as Patrick LeBlanc from Guy in a Cube says ;)), I’ll capture rather the DAX statement and adjust it if needed. To do so, I’ll use the SQL Profiler and connect to the Semantic Model. To get the connection string, I switch back to the Workspace settings, select Premium, and scroll down until I see the connection string. By hitting the button to the right, I copy it.

Now, I open SQL Server Profiler and put the connection string as Server name, select Azure Active Directory – Universal with MFA as authentication method, put in my mail as User name and hit Options.

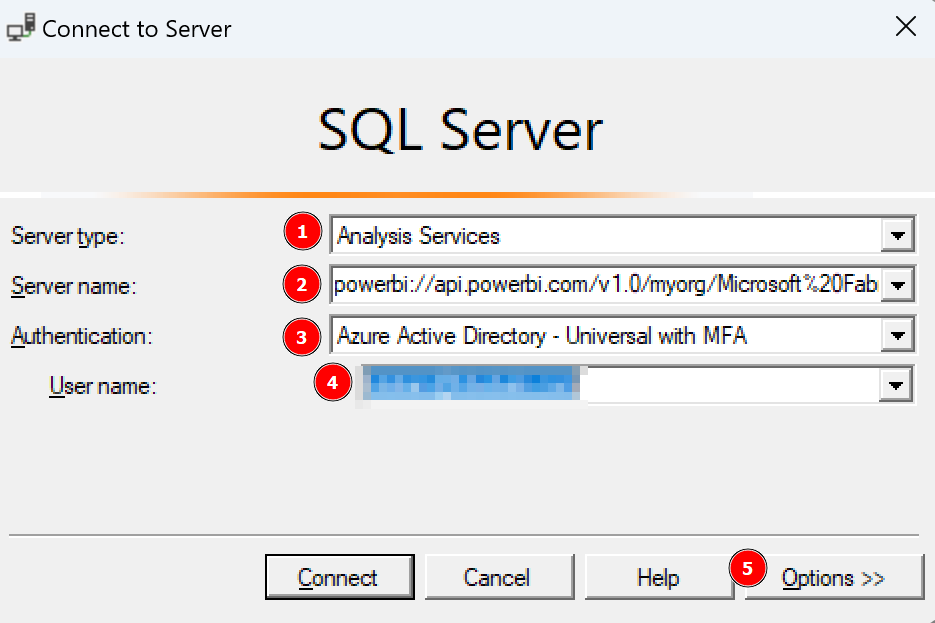
Once the window extends, I select Connection Properties, specify Fabric Capacity Metrics as database to which I wish to connect, and hit Connect.

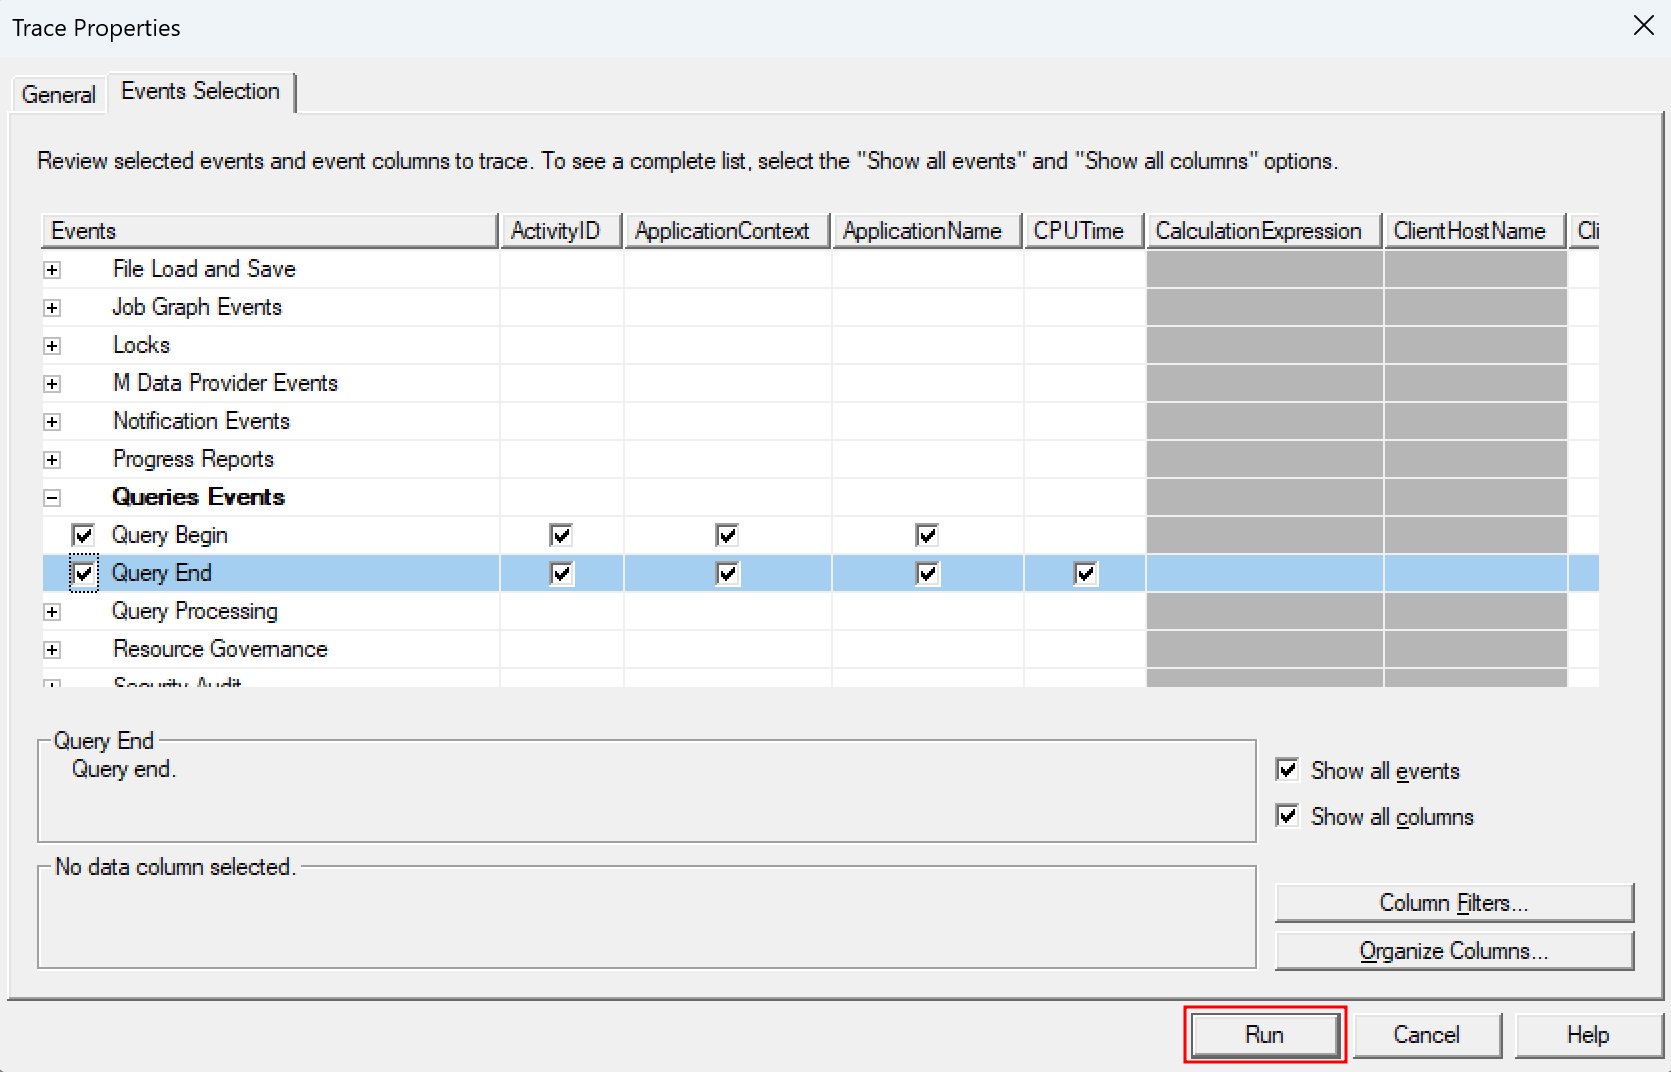
On the next screen, I go directly to Events Selection at the top, extend Queries Events, and select Query Begin and Query End.

With that, I’m prepared to capture the DAX query but I don’t hit Run yet. I wish to make sure to get the right query so I switch back to the Power BI Report and enter the edit mode. Now, I just delete all the visuals except the Interactive Operations table. This way, I make sure no other query is executed and I capture only what I need.

Once prepare, I switch back to SQL Profiler and hit Run.

After our tracer is running, I switch one more time back to the Power BI Report and hit the refresh button at the top right.

Now I see two operations in my Tracer – Query Begin and Query End. If I select one of it, I have now the DAX Query for the interactive Operations.

DEFINE
	MPARAMETER 'CapacityID' = 
		"9C3E7404-D2DA-4CB6-B93F-9873BDD3D95A"

	MPARAMETER 'TimePoint' = 
		(DATE(2024, 3, 20) + TIME(15, 59, 0))

	VAR __DS0FilterTable = 
		TREATAS({"9C3E7404-D2DA-4CB6-B93F-9873BDD3D95A"}, 'Capacities'[capacityId])

	VAR __DS0FilterTable2 = 
		TREATAS({"Dataset"}, 'Items'[ItemKind])

	VAR __DS0FilterTable3 = 
		TREATAS(
			{(DATE(2024, 3, 20) + TIME(15, 59, 0))},
			'TimePoints'[TimePoint]
		)

	VAR __DS0Core = 
		SUMMARIZECOLUMNS(
			ROLLUPADDISSUBTOTAL(
				ROLLUPGROUP(
					'TimePointInteractiveDetail'[OperationStartTime],
					'TimePointInteractiveDetail'[OperationEndTime],
					'TimePointInteractiveDetail'[Status],
					'TimePointInteractiveDetail'[Operation],
					'TimePointInteractiveDetail'[User],
					'TimePointInteractiveDetail'[OperationId],
					'TimePointInteractiveDetail'[Billing type],
					'TimePointInteractiveDetail'[Start],
					'TimePointInteractiveDetail'[End],
					'Items'[IsVirtualArtifactName],
					'Items'[IsVirtualWorkspaceName],
					'Items'[WorkspaceName],
					'Items'[ItemKind],
					'Items'[ItemName]
				), "IsGrandTotalRowTotal"
			),
			__DS0FilterTable,
			__DS0FilterTable2,
			__DS0FilterTable3,
			"SumTimepoint_CU__s_", CALCULATE(SUM('TimePointInteractiveDetail'[Timepoint CU (s)])),
			"SumThrottling__s_", CALCULATE(SUM('TimePointInteractiveDetail'[Throttling (s)])),
			"SumDuration__s_", CALCULATE(SUM('TimePointInteractiveDetail'[Duration (s)])),
			"SumTotal_CU__s_", CALCULATE(SUM('TimePointInteractiveDetail'[Total CU (s)])),
			"Sumv__of_Base_Capacity", CALCULATE(SUM('TimePointInteractiveDetail'[% of Base Capacity]))
		)

	VAR __DS0PrimaryWindowed = 
		TOPN(
			502,
			__DS0Core,
			[IsGrandTotalRowTotal],
			0,
			[SumTimepoint_CU__s_],
			0,
			'TimePointInteractiveDetail'[Billing type],
			0,
			'TimePointInteractiveDetail'[OperationStartTime],
			1,
			'TimePointInteractiveDetail'[OperationEndTime],
			1,
			'TimePointInteractiveDetail'[Status],
			1,
			'TimePointInteractiveDetail'[Operation],
			1,
			'TimePointInteractiveDetail'[User],
			1,
			'TimePointInteractiveDetail'[OperationId],
			1,
			'TimePointInteractiveDetail'[Start],
			1,
			'TimePointInteractiveDetail'[End],
			1,
			'Items'[IsVirtualArtifactName],
			1,
			'Items'[IsVirtualWorkspaceName],
			1,
			'Items'[WorkspaceName],
			1,
			'Items'[ItemKind],
			1,
			'Items'[ItemName],
			1
		)

EVALUATE
	__DS0PrimaryWindowed

ORDER BY
	[IsGrandTotalRowTotal] DESC,
	[SumTimepoint_CU__s_] DESC,
	'TimePointInteractiveDetail'[Billing type] DESC,
	'TimePointInteractiveDetail'[OperationStartTime],
	'TimePointInteractiveDetail'[OperationEndTime],
	'TimePointInteractiveDetail'[Status],
	'TimePointInteractiveDetail'[Operation],
	'TimePointInteractiveDetail'[User],
	'TimePointInteractiveDetail'[OperationId],
	'TimePointInteractiveDetail'[Start],
	'TimePointInteractiveDetail'[End],
	'Items'[IsVirtualArtifactName],
	'Items'[IsVirtualWorkspaceName],
	'Items'[WorkspaceName],
	'Items'[ItemKind],
	'Items'[ItemName]

I could use this query already and execute it in DAX Studio – just to make sure it works as expected.

Make sure to remove the [WaitTime: 0 ms] at the end of the query if you’re copying it from SQL Profiler.

Looks good! I repeat the same steps for the background operations and test is as well in DAX Studio. Once done, I close SQL Server Profiler as tracing is not necessary anymore.

As a next step, let me analyze the generated query and optimize it. I will start this time with the background operations. The first variable defined is a MPARAMETER for the Capacity ID. The second one is as well a MPARAMETER for the Timepoint including the conversion. MPARAMETERS are so-called binding parameters which are passed through from the Power BI report to Power Query. DAX.guide has a great explanation and example here: https://dax.guide/st/mparameter/ This means we have to pass those two values to retrieve the correct result.

Going further, three different variables are defined which are used later on to filter. We have again the Capacity ID, Timepoint, and an Item filter to get only Datasets. As I don’t need the Item filter, I just delete it. For readability reasons, I also renamed the other two variables going from __DS0FilterTable to varFilter_Capacity and from DS0FilterTable3 to varFilter_TimePoint.

My first block of DAX looks like this.

DEFINE
	MPARAMETER 'CapacityID' = 
		"9C3E7404-D2DA-4CB6-B93F-9873BDD3D95A" --add your capacity ID here

	MPARAMETER 'TimePoint' = 
		(DATE(2024, 3, 20) + TIME(15, 59, 0))

	VAR varFilter_Capacity = 
		TREATAS({"9C3E7404-D2DA-4CB6-B93F-9873BDD3D95A"}, 'Capacities'[capacityId]) --add your capacity ID here

	VAR varFilter_TimePoint = 
		TREATAS(
			{(DATE(2024, 3, 20) + TIME(15, 59, 0))},
			'TimePoints'[TimePoint]
		)

Replace the three dots with your Capacity ID.

The next big block is a simple group by logic based on different columns and summarizes different KPIs on top. I simplify and store it as well into a variable.

VAR varTable_Details =
		SUMMARIZECOLUMNS(
			'TimePointBackgroundDetail'[OperationStartTime],
			'TimePointBackgroundDetail'[OperationEndTime],
			'TimePointBackgroundDetail'[Status],
			'TimePointBackgroundDetail'[Operation],
			'TimePointBackgroundDetail'[User],
			'TimePointBackgroundDetail'[OperationId],
			'TimePointBackgroundDetail'[Billing type],
			'Items'[WorkspaceName],
			'Items'[ItemKind],
			'Items'[ItemName],
			
			varFilter_Capacity,
			varFilter_TimePoint,
			
			"Timepoint CU (s)", SUM('TimePointBackgroundDetail'[Timepoint CU (s)]),
			"Duration (s)", SUM('TimePointBackgroundDetail'[Duration (s)]),
			"Total CU (s)", CALCULATE(SUM('TimePointBackgroundDetail'[Total CU (s)])),
			"Throttling", CALCULATE(SUM('TimePointBackgroundDetail'[Throttling (s)])),
			"% of Base Capacity", CALCULATE(SUM('TimePointBackgroundDetail'[% of Base Capacity]))
		)

Lastly, we need an EVALUATE to get a result.

EVALUATE  SELECTCOLUMNS(
    varTable_Details,
    "BillingType", [Billing type],
    "Status", [Status],
    "OperationStartTime", [OperationStartTime],
    "OperationEndTime", [OperationEndTime],
    "User", [User],
    "Operation", [Operation],
    "OperationID", [OperationId],
    "WorkspaceName", [WorkspaceName],
    "Item", [ItemKind],
    "ItemName", [ItemName],
    "TimepointCUs", [Timepoint CU (s)],
    "DurationInS", [Duration (s)],
    "TotalCUInS", [Total CU (s)],
    "Throttling", [Throttling],
    "PercentageOfBaseCapacity", [% of Base Capacity]	
)

This way, we have now an optimized and more readable DAX statement for the Background operations. To get the same optimized query for interactive operations, I only need to replace the TimePointBackgroundDetail table with TimePointInteractiveDetail and I’m already good to go! The whole DAX statement can be found in my GitHub repo.

Now, we have everything on hand to extract the required details on a – for example – daily base. There are various options to achieve it – from Power Automate Flows, to Microsoft Fabric Pipelines, and / or Python Notebooks (Databricks or Microsoft Fabric), and many more. In my next blog post, I’ll walk you through one possible option to store the data into OneLake.

Please let me know if this post was helpful and give me some feedback. Also feel free to contact me if you have any questions.

If you’re interested in the files used in this blog check out my GitHub repo https://github.com/PBI-Guy/blog

Export Power BI Reports as PDF via REST API

It’s been a while since my last post as a lot is going on and I had the pleasure to realize some really interesting projects in the past. One of them was to use the Power BI REST API to download Power BI Paginated Reports as PDF locally to a PC. And this is exactly what I will walk you through in this blog post.

Prerequisites

To be able to export reports programmatically, there are some things needed:

  • Power BI report (it works the same for Power BI or Paginated Reports)
  • Power BI Capacity (either Premium, Embedded, or Fabric)
  • Service Principal with sufficient permission
  • Python skills
  • Tool to write / execute Python code (in my case Visual Studio Code)

Setting the scene

I have a Power BI Workspace assigned to a Power BI Embedded capacity, which has to run during the whole time otherwise I won’t be able to call the Power BI REST API. Further, I have obviously a Power BI Paginated Report to be able to export it to a PDF. In my case, I use the Sales Analysis report which is used as example for the Paginated Report in a Day course. I like this one as it’s simple and uses one Parameter Fiscal Year, which we can also influence during our REST API call.

Let’s code

As usual, the first step working with Python is to import the required libraries. In this case, I’m going to use following ones.

#Import needed libraries
import requests
import json
import pandas as pd
import msal
import os

In my next cell, I specify the required parameters for my Service Principal (if you need to know how to create one, check out this guide here: https://pbi-guy.com/2022/03/10/power-bi-and-activity-logs-with-python/) to be able to authenticate as well as the Workspace, Report ID, and some others. My last parameter will be my local path in which I wish to save the PDF(s).

#Specify Parameters

#Service Principal
client_id = ''
client_secret = ''

#Tenant Specification
tenant_id = ''
authority_url = 'https://login.microsoftonline.com/' + tenant_id
scope = ['https://analysis.windows.net/powerbi/api/.default']

#Report Specification
workspace_id = ''
report_id = ''
dataset_id = ''
base_url = 'https://api.powerbi.com/v1.0/myorg/groups/' + workspace_id + '/reports/' + report_id
format = 'PDF'
body = {

    "format": format
}

#Report File Specification
path = ''

As you probably noticed, there is a Parameter called “format” in which I specify the wished file format (PDF in this case). If you wish to export the reports in another format, you just need to overwrite this specific parameter for example to XLSX or DOCX, depending on your needs.

Now, that we specified all required parameters, we can first authenticate against Power BI Service with our Service Principal. For that, I use following code.

#Use MSAL to grab token
app = msal.ConfidentialClientApplication(client_id, authority=authority_url, client_credential=client_secret)
result = app.acquire_token_for_client(scopes=scope)

if 'access_token' in result:
    access_token = result['access_token']
    header = {'Content-Type':'application/json', 'Authorization':f'Bearer {access_token}'}

Next, we would be able to call the Power BI REST API call to export reports as PDF. Checking the documentation, it highlights that the API is asynchronous. When the API is called, it triggers an export job. After triggering an export job, use GetExportToFileStatus API to track the job status. Read more about the entire flow: Export Power BI reports and Export Paginated reports

This means we need to first call the Export API to trigger an export job. Afterwards, we need to check the status of the export by calling the /exports/{id} API and if succeeded, then we can get and save the file finally.

As I have to make a post resp. get request multiple times, I create in my next cell a function to easy up my life to not write the almost same code over and over again.

#Define Request Functions

#Post Reuqest
def post_request(url, header, body):
    api_call = requests.post(url=url, headers=header, json=body)
    return api_call

#Get Request
def get_request(url, header):
    api_call = requests.get(url=url, headers=header)
    return api_call

Because in my case I have a Paginated Report with Parameters, I’d like to dynamically get all values (Fiscal Year) and create for each year one PDF. If a new year will be added in future, the script should automatically detect that and create a PDF on top of it. For that purpose, I call the Execute Queries REST API to execute a DAX statement to get all Fiscal Year values out of my underlying dataset. Because I created a function in my previous cell, I can just call the post_request function and pass the required parameters to it. Lastly, I have to extract, format, and convert the Fiscal Year values into a Pandas Dataframe. To be sure I got all the values, I print them.

#Execute DAX Statement to get full list for Report Parameter
url_execute_query = "https://api.powerbi.com/v1.0/myorg/groups/" + workspace_id + "/datasets/" + dataset_id + "/executeQueries"
dax = "EVALUATE VALUES('Date'[Fiscal Year])"
query = '{"queries": [{"query": "' + dax + '"}], "serializerSettings": {"includeNulls": "true"}}'
body = json.loads(query)
api_call = post_request(url_execute_query, header, body)

#Transform to Pandas Dataframe
result = api_call.content.decode('utf-8-sig')
result = result.replace('"results":[{', '')
result = result[:len(result)-2]
result = result.replace('"tables":[{', '')
result = result[:len(result)-2]
result = result.replace('"rows":[{', '')
result = result[:len(result)-1]
result = '[' + result
result = json.loads(result)
df_result = pd.DataFrame(result)
df_result = df_result.rename(columns={'Date[Fiscal Year]': 'Fiscal Year'})

print(df_result)

As we can see, I have six Fiscal Year values from 2017 – 2022.

As a next step, we need to call now the /ExportTo API for each Fiscal Year. Thus, I create a for each loop based on the Fiscal Year Dataframe (df_result). As we have to provide a body context in which we can specify the format as well as influence the parameters, I do specifically that. As a response to the call, we get a Export ID which we need later on to be able to export and save the report as PDF. Therefore, I store all of them in one Dataframe called df_export and print it out to make sure I get it for each Fiscal Year.

#Export Report for each value in Report Parameter
export_url = base_url + '/ExportTo'
export_id_list = []
parameter_value_list = []

for index, row in df_result.iterrows():
    current_value = df_result['Fiscal Year'][index]
    body = {
        "format": format,
        "paginatedReportConfiguration": {
            "parameterValues":[
                    {"name": "DateFiscalYear", "value": current_value}
                ]
        }
    }

    api_call = post_request(export_url, header, body)
    export_id = api_call.json()['id']
    export_id_list.append(export_id)
    parameter_value_list.append(current_value)

df_export = pd.DataFrame(list(zip(export_id_list, parameter_value_list)), columns=['Export ID', 'Parameter Value'])
print(df_export)

After we initiated the export for each Fiscal Year, we have to check the status. For that, I created again a for each loop based on the df_export Dataframe this time and check for each Export ID if the status is “Succeeded”. Until then, I print out the current Fiscal Year as well as the current status to have an overview of the current state.

#Get Export Status

for index, row in df_export.iterrows():
    current_export_id = df_export['Export ID'][index]
    current_parameter_value = df_export['Parameter Value'][index]

    url_status = base_url + '/exports/' + current_export_id
    status = ''
    while status != 'Succeeded':
        api_call = get_request(url_status, header)
        status = api_call.json()['status']
        print(status)
        print(current_parameter_value)

Once done, we can finally save our PDF as wished. As I save it in my case on my local machine, I use the os library but obviously you can save the PDF wherever you wish, for example in OneLake, ADLS Gen2, SharePoint, etc. To be able to do that, I once more created a for each loop on the df_export Dataframe and call the /exports/{id}/file API where {id} represents the Export ID from our previous step. Once I got the content, I save it to my local machine. By the way, I influence the file name by providing the current Fiscal Year value (see parameter file_name).

#Save report as PDF

for index, row in df_export.iterrows():
    current_export_id = df_export['Export ID'][index]
    file_name = df_export['Parameter Value'][index]

    url_save = base_url + '/exports/' + current_export_id + '/file'
    api_call = get_request(url_save, header)

    completename = os.path.join(path, file_name + '.' + format)

    with open(completename, 'wb') as f:
        f.write(api_call.content)

As a final result, we get for each Fiscal Year one PDF saved to our local machine!

The whole code looks as now as following.

#Import needed libraries
import requests
import json
import pandas as pd
import msal
import os

#Specify Parameters

#Service Principal
client_id = ''
client_secret = ''

#Tenant Specification
tenant_id = ''
authority_url = 'https://login.microsoftonline.com/' + tenant_id
scope = ['https://analysis.windows.net/powerbi/api/.default']

#Report Specification
workspace_id = ''
report_id = ''
dataset_id = ''
base_url = 'https://api.powerbi.com/v1.0/myorg/groups/' + workspace_id + '/reports/' + report_id
format = 'PDF'
body = {

    "format": format
}

#Report File Specification
path = ''

#Use MSAL to grab token
app = msal.ConfidentialClientApplication(client_id, authority=authority_url, client_credential=client_secret)
result = app.acquire_token_for_client(scopes=scope)

if 'access_token' in result:
    access_token = result['access_token']
    header = {'Content-Type':'application/json', 'Authorization':f'Bearer {access_token}'}
	
#Export Report for each value in Report Parameter
export_url = base_url + '/ExportTo'
export_id_list = []
parameter_value_list = []

for index, row in df_result.iterrows():
    current_value = df_result['Fiscal Year'][index]
    body = {
        "format":"PDF",
        "paginatedReportConfiguration": {
            "parameterValues":[
                    {"name": "DateFiscalYear", "value": current_value}
                ]
        }
    }

    api_call = post_request(export_url, header, body)
    export_id = api_call.json()['id']
    export_id_list.append(export_id)
    parameter_value_list.append(current_value)

df_export = pd.DataFrame(list(zip(export_id_list, parameter_value_list)), columns=['Export ID', 'Parameter Value'])
print(df_export)

#Get Export Status

for index, row in df_export.iterrows():
    current_export_id = df_export['Export ID'][index]
    current_parameter_value = df_export['Parameter Value'][index]

    url_status = base_url + '/exports/' + current_export_id
    status = ''
    while status != 'Succeeded':
        api_call = get_request(url_status, header)
        status = api_call.json()['status']
        print(status)
        print(current_parameter_value)
		
#Save report as PDF

for index, row in df_export.iterrows():
    current_export_id = df_export['Export ID'][index]
    file_name = df_export['Parameter Value'][index]

    url_save = base_url + '/exports/' + current_export_id + '/file'
    api_call = get_request(url_save, header)

    completename = os.path.join(path, file_name + '.' + format)

    with open(completename, 'wb') as f:
        f.write(api_call.content)

Please let me know if this post was helpful and give me some feedback. Also feel free to contact me if you have any questions.

If you’re interested in the files used in this blog check out my GitHub repo https://github.com/PBI-Guy/blog

Track Power BI Capacity overloaders with Power Automate

Note from PBI Guy: A few weeks ago I had the pleasure to meet Manel Omani, a colleague of mine, who presented a super interesting solution how she’s tracking Power BI Capacity overloaders via Power Automate and notify automatically the Dataset owner. I thought this has to be shared with the Power BI community and asked here to create a blog post about it. Luckily, she agreed and I’m happy to share the result here.

As a Power BI Capacity administrator, have you ever experienced multiple slowdowns and noticed that too late ? This is a very common issue that capacity administrators face when they track and monitor the usage of memory/CPU of the artifacts. Thankfully, in the capacity setting we still have the possibility to set notifications whenever the load reaches x%, or when it exceeds the available capacity. This notifications are helpful to detect the slowdowns early on, but do not really help to highlight which artifact is consuming more resources than the others. To get this information, you need to check it on  “the Premium metrics app”. 

The idea of this article is to propose ways to combine the Premium metrics app and Power Automate in order to set notification to the owner of the artifact causing slowdowns on the capacity so that they can work on optimizing their data model and prevent future slowdowns. 

Overloaders detection on Power BI Premium: the approach 

Capacity overload happens when one consumes more CPU in a 30sec interval than what the capacity allows. For instance, if you have a P1 capacity, you can consume 8 cores * 30 sec = 240 sec of CPU time. If you exceed 240 sec CPU time in a 30 sec interval, all the queries that follow with be delayed. 

This overload can be detected on the Premium metrics app on the CPU% chart.

And from the Premium metrics app dataset we can run the following DAX query by using DAX Studio to get the list of overloaders IDs:

Keep in mind that your workspace have to be backed up by a capacity to be able to connect with DAX Studio to your Dataset and execute the statement.

This DAX query gives us the list of artifacts that has raised an overload in the last 24 hours. The results are as follows:

This DAX Query is run on the Data Model of the Premium App Monitoring. Please note that this DAX query may need to be changed if the data model of the App Monitoring is updated.

Now that the overloaders are identified, the objective is to get the owner of these artifacts and the details behind the overloading. As the Premium Capacity app does not hold this data, we need to find another approach to retrieve the owner of the dataset. One way is to use the Power BI Rest API: https://api.powerbi.com/v1.0/myorg/datasets/{datasetId} which can provide the email address of the user who configured the dataset.

Now, to get the details of the overload, such as “how many times the dataset has raised an overloading” or “how much CPU has been used”, we can run another DAX query over the Premium App monitoring dataset as follows:

The results can be seen below:

With all these information, we can notify through email or a Teams message, the owner of the dataset (extracted from the Power BI rest API), with all the required information to handle the overload. It is also possible to save all these information periodically (in a Blob storage, DWH, CSV files, etc.), so that we can analyze the “bad students” of the Premium capacity and help them optimize their data model.

Overloaders detection on Power BI Premium: Setting the scene with Power Automate

For this example, we are going to use Power Automate to automate the e-mail/Teams notification to the owner of dataset who caused an overload in the last 24 hours with all the dataset consumption details.

Please note that Power Automate offers many ways to send notification or to store the data collected.

Once I logged into Power Automate, I will start by creating a flow with a scheduled Cloud Flow. The idea again is to run this flow each morning to see the overloaders of yesterday:

Let’s first create 3 variables that will help us later with our configuration:

  1. The first variable “CapacityName” will store the Premium Capacity ID
  2. The second variable “timeDiffrence inHours” will store how many hours I want to look at ( in my case, I’m using 24 hours)
  3. The third variable “Overloader details table” is an empty array that will be used to store the overloading details of each dataset so we can use it to send that to the owner.

After the creation of these variables, we will run our first DAX query in Power Automate by using the “Run a Query against a Dataset” Power BI action as follows:

Now that we have the IDs of the dataset that has caused an overloading in the last 24 hours, we will need to get their owner.

To get this information, I created a custom connector that will call a Power BI REST API : https://api.powerbi.com/v1.0/myorg/datasets/{datasetId}

You can find all the details of creating such connector on this article: Power BI – Custom Refresh with Power Automate
It’s not required to go through a Custom Connector. You could also use the HTTP Action but for reusability purpose it’s much easier with a custom connector.

The “run a query against a dataset” action will return a JSON list that contains the IDs of the dataset. We will need to loop on each row in order to get their owner and run a second DAX query that will retrieve the overloading details. To do so, we will use “Apply to each” action in the flow and parse each “First Table rows” as follow:

After parsing the result of the DAX query, we will call the custom connector created earlier in order to get the owner of the dataset:

Now that we have the ID of the dataset parsed (Items[ItemID]) and the Owner of this dataset (ConfiguredBy), we can run our second DAX query to retrieve the details of overload of this dataset as follows:

Same thing here, we will need to parse the query result and use it to initiate our Table variable that will hold the throttling details for each dataset:

Now that we parsed our data and initiate a Table variable with the throttling detail (for only one dataset), we will create and HTML table that we can use in order to notify the dataset owner with the overloading that he created. Here you have the choice to either send and e-mail or Teams message, or even store the result in a SharePoint or Blob Storage:

The full flow is presented as follow:

For this, we just used some DAX statement to identify the overloaders and combined the information afterwards with a REST API call to retrieve the Dataset owner. Obviously, there are multiple ways to achieve the same goal but I hope I showed you in a low-code manner how to achieve this goal.

Please let me know if this post was helpful and give me some feedback. Also feel free to contact me if you have any questions.

If you’re interested in the files used in this blog check out my GitHub repo https://github.com/PBI-Guy/blog

Export Paginated Reports automatically in a low-code way without Power BI Premium

From time to time I got asked how customers can export Paginated (or Power BI) Reports automatically to store them e.g. in OneDrive or any other location. One way is obviously to do it manually, but we’re looking for an automatic way. So why not use the out-of-the-box Subscribe button within Power BI Service? Because it will send you an email and you can’t decide to store it somewhere else. Luckily, Power BI offers an API to achieve what we’re looking for. But what if I’m not a developer and don’t know how to write code e.g. in PowerShell or Python? No worries, Microsoft got you covered with Power Automate!

Prerequisites

There are a few things which are needed to be able to follow this approach. First of all, Paginated Reports are part of a Power BI Pro license BUT if you wish to export a Paginated Report automatically, you still need a capacity (Premium or Embedded) to be able to do so. Reason is to make sure the end user is licensed in a proper way because through Premium the end user requires only a Free license. If you try to export a Paginated Report through the API backed up with a Pro license, you’ll get an error as you can’t make sure the end user also have a Pro license. That’s the reason why a capacity is needed. But buying Power BI Premium just to be able to export PDFs automatically is probably an overhead. Therefore we’re looking for a more cost-effective way which can be achieved with Power BI Embedded. Why? Because Power BI Embedded can be paused and it will not generate any cost at all! So we can turn it on just when needed, export our PDFs, and shut it down afterwards! Keep in mind while Embedded is paused the Reports in the associated workspaces will not be accessible.

So here’s a list of what we need:

  • Power BI Pro license
  • Power BI Embedded
  • Power Automate license
  • Service Principal with sufficient permission
  • Basic understanding of REST API
  • Basic know-how of DAX

Because we’re going to call the REST API to start and pause our Power BI Embedded capacity with Power Automate, the HTTP connector is needed which is Premium (as of February 2023). Therefore the O365 included licenses is not enough as “only” Standard Connectors are included.

If you’re interested in Power Automate Licensing please check the actual guide. Prices can be found here: https://powerautomate.microsoft.com/en-us/pricing/

Setting the scene

For my example I’m going to reuse the Sales Analysis Paginated Report from the Paginated Report in a Day course. I want to create one PDF for each Fiscal Year automatically and save each PDF into OneDrive.

I published the Report to my “Demo” workspace which is backed up by an Embedded Capacity. Creating an Embedded Capacity is straight forward through the Azure Portal. A how-to guide can be found here: https://learn.microsoft.com/en-us/power-bi/developer/embedded/azure-pbie-create-capacity, For our example the smallest (A1) SKU is enough.

Further, I prepared a folder in OneDrive called “Demo” where I wish to save my PDFs.

Let’s get started with Power Automate

Once I logged in into Power Automate via https://flow.microsoft.com/en-us I select “+ Create” on the left hand side and select “Instant cloud flow”. This means I can trigger my flow manually which is handy during development. Once done, I can change the trigger to e.g. a schedule like every Monday morning at 7am. After the new window pop up, I name my Flow as wished (PBI Guy – Save PDF from Paginated Reports), select “Manually trigger a flow”, and hit the Create button.

Let’s first test if I can save a PDF export into OneDrive and focus on starting & pausing the Capacity in a next step. So our first step is to get the PDF and then save it into OneDrive. To create a new action, just select the + New Step. Now, search for Power BI and select the build-in Power BI Connector. Once selected, scroll and search for “Export To File for Paginated Reports”.

Afterwards, we have to configure our action by selecting our Workspace, Report, wished Export Format, and specify our Parameter which is Fiscal Year in this case. Be cautious by naming the Parameter as you need the internal name, not the label of the Parameter. Therefore you have to open the Paginated Report with Report Builder and check the internal Parameter name.

In my case it’s called “DateFiscalYear”.

Now that I have all needed details I switch back to my Flow and configure the action by selecting the Workspace (Demo), afterwards a list of my Paginated Reports will appear where I select the Sales Analysis, and choose my wished Export Format. Per default it’s PDF but you can also choose another option if you wish. Next, I provide the Parameter name and add a Value (FY2019) for testing purpose.

Next, I add a New Step by hitting the button, search for OneDrive, select OneDrive for Business, and select “Create File” as new action.

Afterwards, I just configure the Path by selecting the small folder icon and browse to my wished destination. I add FY2019.pdf as file name and choose the File Content from the dynamic content pane as File Content for my action. If you somehow don’t see the dynamic content, just hit the button at the bottom right to expand it.

Let’s test the flow and see if a PDF will be saved into OneDrive. To do so just click at the top right on the Test button. A new pane will appear, just select Manually and hit Save & Test.

Running it the first time I need to sign in to the different connectors I’m using (Power BI and OneDrive). Just Continue to do so and hit as last step Run Flow. Keep in mind that the Power BI Embedded capacity has to run otherwise you’ll get an error as the Report is not available.

After approx. 1 Minute our Flow will finish and checking OneDrive I can see a new PDF has been created. Great! Opening it shows me that even the Parameter FY2019 has been passed and I see only FY2019 data – awesome! But now let’s parametrize it a little so my Flow will create a PDF for each FY available and not only FY2019. To do so I switch to Edit mode by selecting the appropriate button at the top right and add a new step right after our manual trigger by clicking on the + sign. I again search for Power BI and choose “Run a query against a dataset” as action. In here I select again my Demo workspace and Sales Analysis Dataset. The idea is now to run a DAX statement against the Sales Analysis Dataset to get all FY values which we will reuse to generate our PDF and save it. I quickly open DAX Studio, connect to my Dataset, and generate an EVALUATE DAX statement to get all FY values of my date table.

EVALUATE DISTINCT('Date'[Fiscal Year])

ORDER BY 'Date'[Fiscal Year]

I copy and paste the whole DAX statement into the query text of the action in my flow.

Again, to test if it works, I rerun the Flow and check the Output of my new action. As I can see there are different FY values as expected – perfect! I copy the whole output as we will need it for our next step.

I switch back to Edit mode and add a new step between the two Power BI actions. I search for JSON and select the Parse JSON action. Next, I add into the Content field the “First table rows” dynamic content from my previous step. Lastly, I hit the Generate from sample button and paste the result I copied a few seconds ago. This will automatically create a schema.

This step is needed to be able to get each value and reuse it afterwards to create for each FY a PDF. Before I move to my next step, I want to rename my Actions making sure by just reading them each user can understand what is happening. To do so, just select the three dots for each step and rename it accordingly. In my case I renamed the steps as following.

Now, let’s parametrize our Export to reuse the FY values dynamically. To do so, I select the Export action, scroll down to ParameterValues value section, delete my hard coded FY2019 and add Date[Fiscal Year] as dynamic content from my previous step. This will automatically create a “Apply to each” around my step.

Next, I drag and drop the “Save PDF into OneDrive” action into the Apply to each container and position it below the Export action. Lastly, I delete the hardcoded file name and again add the Date[Fiscal Year] dynamic content and add .pdf at the end. Otherwise it will not be saved as such.

Again, let’s test our flow and check the result. After roughly 4 minutes our flow has finished and I see 6 different PDFs in my OneDrive, one for each FY – awesome!

Now we have to make sure to pause the Power BI Embedded Capacity once the job is done. Also, we want to make sure it starts once the flow has started otherwise the PDFs can’t be generated. Let’s first focus on starting the capacity.

The official Microsoft Documentation shows the necessary REST API call to start resp. resume the capacity. There are different parameters which are needed:

  • subscriptionId
  • resourceGroupName
  • dedicatedCapacityName

The full POST request looks as following:

https://management.azure.com/subscriptions/{subscriptionId}/resourceGroups/{resourceGroupName}/providers/Microsoft.PowerBIDedicated/capacities/{dedicatedCapacityName}/resume?api-version=2021-01-01

So let’s create these three parameters in our Flow to make it easier to use and reuse them. After switching back to my Flow I add a new action right after the trigger to create the parameters as a first step. I search for Variable and select “Initialize Variable”. I name the first variable “Subscription ID”, make it a String type and enter my Subscription ID as Value. If you don’t know the Subscription ID, just check it in your Azure Portal by selecting the Embedded Capacity.

I rename my action from Initialize variable to Define Subscription ID Variable and redo the steps for Resource Group Name and Dedicated Capacity Name Variables.

Now, let’s try to call the REST API with the HTTP action. Again, just hitting the + Button after my variables and search for HTTP. Once selected, I can configure it. The Method we have to use is POST based on the documentation. In the URI field I copy and paste the whole REST API call. Once copied, I delete the general parameter from the URL (everything between and including the {}) and replace it with the previously created variables from the dynamic content pane. In the Headers section, I add Content-Type as key and application/json as value. Because the REST API is not publicly available we have to log in somehow to be able to call it. Therefore, we can expand the advanced options and choose our authentication method. As I work mostly with Service Principals, I select Active Directory OAuth. Once selected, there are a few more things to fill out.

In one of my previous blog posts I showed how to create a Service Principal (https://pbi-guy.com/2022/03/10/power-bi-and-activity-logs-with-python/) and also did a walk-through how to give the sufficient permission to the SP to start and pause the Embedded Capacity (https://pbi-guy.com/2022/09/22/assign-power-bi-workspaces-to-a-capacity-automatically/).

Let’s see how we can get the needed details. The Client ID as well as the Tenant ID can be found in the overview of the Service Principal.

The Secret can be generated from the Service Principal or, like in my case, I have it stored in Azure Key Vault so I add a new step before the HTTP Call to get the secret out of it. To do so, again, I hit the + button, search for Azure Key Vault, and select Get Secret. In there, I can select the different Service Principals I have access to but because I have to provide the Client ID in the HTTP request as well, let’s parametrize it and create a variable one step before called Client ID. Further, let’s add a variable for the Tenant ID as well. Once done, I can now use the variable within my Get Secret action by selecting Enter custom value and select the Client ID variable.

Further, I can now add the variables to the associated places in my HTTP action and use the value of my Secret action. Lastly, Audience have to be added which is in this case https://management.core.windows.net.

Let’s try and run our Flow to test it. If everything is set up correctly, you’ll get an error because the Power BI Embedded capacity is already running and you can’t start it again. Therefore following error will appear:

This means we need to check the status and, if it is paused, call the API, otherwise skip this part. And how can we check the status? Through REST API! Power BI offers an admin call to get all capacities (see https://learn.microsoft.com/en-us/rest/api/power-bi/admin/get-capacities-as-admin) We’re going to call it and check the status. So let’s create another HTTP request above the current one. This time, according to the documentation, we use a GET method and paste https://api.powerbi.com/v1.0/myorg/admin/capacities into the URI field. As headers we use again Content-Type as key and application/json as value. To be able to authenticate I’m going to use again my Service Principal and luckily, I have everything stored in variables so I can just put them into the right place. Only the audience will change this time as we’re connecting to Power BI now, not to Azure, therefore I have to use https://analysis.windows.net/powerbi/api for it.

If I run the Flow now, it will still fail at the second HTTP action, but I get the result of the Power BI REST API and can check what the status is of my Embedded Capacity.

As a next step, I want to filter the result to only my capacity and extract the status. To be able to do so, I have to parse the body again to JSON and filter it afterwards. So, I copy again the whole body from the HTTP request and switch back to Edit mode. Once there, I add a new step after the Power BI REST API call and search for JSON and select Parse JSON. As content, I add the Body and generate the schema from a sample again by pasting it into the window after I hit the Generate from sample button. Now we have generated an Array which can be filtered. Therefore as next step I search again for Filter Array and select it. I put value from my previous step into From, select displayName as value on which I wish to filter and say it should be equal to my variable Capacity Name.

Now, that we filtered our result down to our desired capacity, we can do a check on the status. Let’s add a new step and search for Condition. In there, I add state from my previous step and configure is equal to “Active”. Once state is added as dynamic content, an Apply to each container will be automatically created. Just leave it as it is.

As next step, I drag and drop the HTTP request to start my capacity into the “If no” stream. This means, if the status is active, I don’t have to call the API to start it but if it’s not active, I would like to start it via REST API. As Power Automate will not wait until the Capacity is running and just continue to the next step, I want to make sure the capacity is in the desired state by adding a delay action of 30 seconds. Obviously, I could create a loop calling the Power BI REST API checking the status and, once changed to active, to proceed, but I’m not interested in the most performant way to execute this Flow but rather in an efficient, low-code way. Therefore the easiest method is to just add a delay.

Let’s one more time test our Flow making sure it’s working as expected. You’ll see, because the capacity is still running, it will go the “If yes” path and not call the REST API this time to start it. Therefore no error occurred and the PDFs have been generated again – great! And as you see the PDFs have been overwritten as we’re using the same name. This is expected behavior.

As a last thing we have to make sure now that our capacity will pause once the Flow is done. Again, checking the documentation there is almost the identical REST API call to pause resp. suspend the capacity. All we need to do is change “Resume” to “Suspend”. To be as sufficient as possible, let’s go to our Start Power BI Embedded action, hit the three dots, and choose Copy to my clipboard.

Now, I hit the + New step at the bottom of my flow, switch to My clipboard and select the copied action.

All I have to do now is to rename it and adjust the URI. What a time saver!

That’s it! Let’s test our final Flow by running it again. After roughly 4-5 minutes the Flow is done and I see on one hand that new PDFs have been created in my OneDrive and on the other hand my Power BI Embedded Capacity is now paused.

Let’s run it again making sure if the capacity is paused that the Flow will start it, still create the PDFs, and then shut it down. And again, after like 5 minutes it was successful. Checking the condition action in the Flow, we see the expression was false (capacity status is not active) and it went the right path to start it – perfect! During the run you could also refresh the page in Azure Portal to check the status of your capacity and you’ll see how it changed from Paused to Active and back to Paused.

The really last thing now is to delete the manual trigger at the top and replace it with what’s needed. E.g. a Schedule to run it every Monday 7:00am like in this example. Obviously, you can also choose other triggers depending on your needs. Keep in mind that Power BI offers a Power Automate visual out-of-the-box which can be used to trigger our Flow as well – from insights to action!

Please let me know if this post was helpful and give me some feedback. Also feel free to contact me if you have any questions.

If you’re interested in the files used in this blog check out my GitHub repo https://github.com/PBI-Guy/blog

Assign Power BI workspaces to a capacity automatically

In recent discussions with customers, I was asked if there is an automatic way to assign workspaces to dedicated capacities like Power BI Premium or Embedded. Obviously, you can do it manually through the Power BI Admin Portal, but how can you automate it in a scenario where you have to assign hundreds of workspaces based on different conditions? I’m sure you know my answer for this question: Through the Power BI REST API! Let me walk you through how to achieve it.

Prerequisites

You’ll need a few things to be able to automate this need.

  • Service Principal
  • A dedicated capacity (Power BI Premium, Embedded, or Premium per User license)
  • Python skills
  • Understanding REST APIs

Setting the scene

For my demo purpose I’m going to use a Power BI Embedded capacity – a so-called A-SKU – from the Azure Portal. If you’re interested in how to create an Embedded capacity, follow this link.

Further, I’m going to reuse my already created Service Principal (SP). I blogged about how to create a SP, what kind of settings in your Power BI Service you need to enable, and what kind of permissions are needed here.

Lastly, I have to make sure my SP can assign workspaces to the capacity. Regarding the documentation (see here) the SP needs admin rights on the workspace as well as capacity assignment permissions to that capacity.

Unfortunately, the Admin REST API does not support (yet?) Service Principals to assign workspaces to a capacity. Therefore, we have to make sure that the SP is admin of each workspace we wish to move to a capacity. Luckily, there is an Admin API to assign yourself as Admin or a SP to a workspace (see here). If you’re interested in a blog about assigning a SP to different workspaces, let me know and I’ll be happy to blog about it.

So, let’s make sure the SP has sufficient permissions.

Add SP as Admin to a workspace

This step is pretty easy and straight forward. Just head over to powerbi.com, select your workspace, click on Access, and make sure your SP is added as Admin.

As you can see in the screen shot above, the workspace is not assigned to a capacity yet otherwise it would have a diamond sign right to the workspace name (PBI Guy).

Add SP as Capacity Admin

In the case of Power BI Embedded you can’t differentiate between admins and contributors like with Premium. Therefore, I have to add the SP as admin in the Azure Portal. To do that I just log in to the Azure Portal, select my Power BI Embedded capacity, and click on Power BI capacity administrators. Once there, click + Add, search for your SP and add it. That’s it. Just make sure your Embedded Capacity is running otherwise you can’t add a new admin.

Further, we have to make sure the Service Principal is allowed to start and pause the embedded capacity. This is done through the Access control on the left-hand side of the pane. Once selected, click + Add and select Add role assignment.

Next, select the needed role. In my case I just give the SP Owner rights but Contributor would be sufficient as well. Once selected, hit next.

On the next screen just select the + Select members, search and add the SP to it. Click select to proceed.

Lastly, hit Review + assign to check your configuration.

If everything looks as expected, hit Review + assign again. We’re now good to go and create our Python script.

It’s time for magic!

As usual, in my first block of code I’m going to import the needed libraries.

#Import necessary libraries

import msal
import requests
import json
import pandas as pd
import time
from azure.identity import DefaultAzureCredential

In my second block, I specify all required variables which we will use later on.

#Set variables

client_id = "" #Service Principal ID
client_secret = "" #Secret from Service Principal
tenant_id = '' #Tenant UID, can also be found in the Service Principal Overview under "Directory (tenant) ID"
domain = '' #Your domain name
authority_url = "https://login.microsoftonline.com/"  + domain
scope = ["https://analysis.windows.net/powerbi/api/.default"]
subscriptionId = '' #Subscription ID on which the PBI Embedded is running
resourceGroupName = '' #Resource Group Name in which the PBI Embedded capacity has been created

The client id, secret as well as the tenant id can be found in the Overview page of your SP.

The domain is everything behind the @ of your email address, e.g. kristian@pbiguy.com would mean “pbiguy.com”.

Authority URL and the scope shouldn’t be touched as those are needed to authenticate for the PBI Service. Lastly, the subscription name and resource group name can be found in the Azure Portal on the Power BI Embedded Services overview.

Just keep in mind to use the Subscription ID, not the name!

Next piece of code is to grab a token on behalf of the SP.

#Use MSAL to grab token
app = msal.ConfidentialClientApplication(client_id, authority=authority_url, client_credential=client_secret)
result = app.acquire_token_for_client(scopes=scope)

In my next step, I want to list all capacities I have access to. Because I’ll need to do that twice within the code (explanation will follow), I create a function, so I don’t have to duplicate my code. The function returns a Pandas DataFrame with all capacities incl. further details.

#Function to get all available capacities
#Power BI Premium Per User will also be listed as capacity separately

def get_all_capacities():
    """Get all available capacities the user has access to.
    Power BI Premium per User will be listed separately.
    Returns a Pandas Dataframe with Capacity ID, Name, Admins, SKU, state, User AccessRight, Region, and Users."""
    url_get_all_capacities = "https://api.powerbi.com/v1.0/myorg/admin/capacities"
    
    if 'access_token' in result:
        access_token = result['access_token']
        header = {'Content-Type':'application/json', 'Authorization':f'Bearer {access_token}'}
        api_call = requests.get(url=url_get_all_capacities, headers=header)
        result_value = api_call.json()['value']
        df_all_capacities = pd.DataFrame(result_value)
        return df_all_capacities

Next, I want to select my desired capacity, which is in my case the Power BI Embedded one. So, I call the function to get all capacities and filter the result, based on the capacity id, to my Embedded one. Making sure the right one is selected, I print out the capacity name as well as the status (is it running or paused).

#Filter to PBI Guy Demo Capacity
df_all_capacities = get_all_capacities()
capacity_id = '163A01FC-6115-4305-9007-A03391B0B151'

#Extracting state and name in separate variables
capacity_status = df_all_capacities.loc[df_all_capacities['id'] == capacity_id].iloc[0]['state']
capacity_name = df_all_capacities.loc[df_all_capacities['id'] == capacity_id].iloc[0]['displayName']

print("Status: " + capacity_status + ",", "Name: " + capacity_name)

The result is as desired, and I only selected my Embedded capacity.

Now that I got the needed capacity, it’s time to get all workspaces I wish to assign to this capacity. Therefore, my next step is to call the REST API to list all workspaces the SP has access to. To get an overview, I display the DataFrame at the end.

#Get all Workspaces the user has access to
url_get_all_workspaces = 'https://api.powerbi.com/v1.0/myorg/groups'

if 'access_token' in result:
    access_token = result['access_token']
    header = {'Content-Type':'application/json', 'Authorization':f'Bearer {access_token}'}
    api_call = requests.get(url=url_get_all_workspaces, headers=header)
    result_value = api_call.json()['value']
    df_all_workspaces = pd.DataFrame(result_value)
    display(df_all_workspaces)

For my purpose, I filter the workspaces to only include those with “BI” in the name. Of course, you can create further conditions and filter options based on your needs.

#Filter to needed workspaces. In this case all workspaces with "BI" in the name will be used.
df_selected_workspaces = df_all_workspaces[df_all_workspaces['name'].str.contains('BI')]
display(df_selected_workspaces)

Again, I display the DataFrame at the end to check my filter and selection. Looks good so far.

Let’s do a quick recap what we achieved so far. We have our capacity selected to which we want to assign our workspaces. We also selected all the workspaces we wish to assign to our capacity. As a next step, we have to assign them. But before doing so, especially in the case of Power BI Embedded, we have to make sure that the capacity is running and not paused. Thus, my next block of code will check the status and if it’s paused (suspended), I’ll start (activate) it. This step is not necessary for Premium capacities as they are always active.

I’ll first create a function to get an Azure token. This one differs from the Power BI one as we have to log in into Azure and not Power BI.

Next, I define a function to create the URL to start or pause the capacity. As the REST API URL is very similar and only the last piece (status variable) differs, it’s much more efficient due to reusability reasons to work with a function in this case.

Lastly, I use the capacity status from my previous code to check if it’s suspended. If so, I call the previously created function to create an Azure Token and call the REST API to resume the capacity. At the end of the code, I print out a message based on the status code received.

#Check status of Capacity
#If Suspended, Resume it to be able to assign workspace

def get_az_token(tenant_id, client_id, client_secret):
    """Function to get an Azure Token.
    3 variables are required: tenant_id, client_id, and client_secret."""
    data = "grant_type=client_credentials&client_id=" + client_id + "&client_secret=" + client_secret + "&resource=https%3A%2F%2Fmanagement.azure.com%2F"
    url = "https://login.microsoftonline.com/" + tenant_id + "/oauth2/token"
    response = requests.post(url, data=data)
    AccessToken = response.json()["access_token"]
    return AccessToken

def create_url (subscriptionId, resourceGroupName, pbiCapacityName, status):
    """Function to change status of capacity.
    Required variables are subscriptionId, resourceGroupName, pbiCapacityName, and status."""
    url = 'https://management.azure.com/subscriptions/' + subscriptionId + '/resourceGroups/' + resourceGroupName + '/providers/Microsoft.PowerBIDedicated/capacities/' + pbiCapacityName + '/' + status + '?api-version=2021-01-01'
    return url

if capacity_status == 'Suspended':
    azToken = get_az_token(tenant_id=tenant_id, client_id=client_id, client_secret=client_secret)
    url = create_url(subscriptionId, resourceGroupName, capacity_name, 'resume')
    header = {'Content-Type':'application/json', 'Authorization':f'Bearer {azToken}'}
    api_call = requests.post(url=url, headers=header)

    if api_call.status_code == 202:
        print('Successfully changed status to resume.')

    if api_call.status_code == 400:
        print('An error occured. Probably the capacity is already in status running.')

    if api_call.status_code == 403:
        print('No sufficient permission to perform this action. Make sure the user has enough right on Capacity.')

As it takes some time to activate the capacity, I’ll check in my next code block if the capacity is really active. Otherwise, I would get an error message trying to assign a workspace to a suspended capacity. Now, I call the get_all_capacities function to get again all capacities, filter down to my desired one, and save the status in a separate variable called capacity_status. Next, I do a while loop if the status is suspended and check all 5 seconds until the status has changed to active. This way I make sure the capacity is really in active stage.

#Check status of Capacity, wait until it changed
df_all_capacities = get_all_capacities()
capacity_status = df_all_capacities.loc[df_all_capacities['id'] == capacity_id].iloc[0]['state']

while capacity_status == 'Suspended':
    print("Capacity is still suspended. Checking status in 5 seconds again.")
    time.sleep(5)
    df_all_capacities = get_all_capacities()
    capacity_status = df_all_capacities.loc[df_all_capacities['id'] == capacity_id].iloc[0]['state']
    if capacity_status == 'Active':
        print("Capacity is active.")
        break

Let’s check in the Azure Portal, if the capacity is really running. I select the general overview of the Power BI Embedded service and see that my embedded capacity has an active status – great!

Finally, I can assign now my workspaces to the capacity. I create a for each loop on my selected workspaces DataFrame to assign each workspace obviously to the capacity (bulk update is not supported through the API). In the loop I extract the workspace ID and the name, update the URL for the REST API call (including the workspace ID), and specify the required body. In there, you’ll find the capacity_id variable specifying to which capacity we wish to assign the workspace. At the end I call the REST API and provide a message based on the status code received. If it’s successful, I print out a message with the workspace and capacity name confirming it worked.

# If you wish to unassign the workspace and move it back to Power BI Service, use the zeros GUID capacity ID
#capacity_id = '00000000-0000-0000-0000-000000000000'
#capacity_name = 'Power BI Service'

for idx, row in df_selected_workspaces.iterrows(): #Iterate through each workspace
    workspace_id = row['id'] #Store the workspace ID in a separate variable
    workspace_name = row['name'] #Store workspace name in a separate variable

    #configure URL to call to remove license from user
    url_assign_to_capacity = "https://api.powerbi.com/v1.0/myorg/groups/" + workspace_id + '/AssignToCapacity'

    body_assign_to_capacity = {
        "capacityId": capacity_id
    }

    if 'access_token' in result:
        access_token = result['access_token']
        header = {'Content-Type':'application/json', 'Authorization':f'Bearer {access_token}'}

        api_call = requests.post(url=url_assign_to_capacity, headers=header, json=body_assign_to_capacity)
        
        if api_call.status_code == 200:
            print('Workspace', workspace_name, 'successfully assigned to new Capacity:', capacity_name)

        if api_call.status_code == 400:
            print("Power BI returned a Bad Request error. Make sure the capacity:", capacity_name, "is running to which you wish to assign the workspace to.")

        if api_call.status_code == 401:
            print("You don't have sufficient permission to assign this workspace to the desired capacity. Please make sure the Service Principal has contributor permission on the capacity and is admin of the workspace.")

If you wish to unassign a workspace from a capacity and put it back to Power BI Service (Shared Capacity), just use the 00000000-0000-0000-0000-000000000000 GUID for the capacity_id variable.

Let’s check in the Power BI Service if it really worked.

Great! First sign that it worked is the diamond icon right to the workspace name. Making sure the workspace is really assigned to the right capacity, I also check the workspace settings. Looks perfect!

My last step in the Python code is to pause the capacity making sure no additional or unnecessary costs will occur as I’m using the Power BI Embedded one. Depending on the number of workspaces, the Azure Token could be expired. Therefore, I want to make sure I have still an active one and call the get_az_token function again to get a fresh token. Afterwards, I call the create_url function but this time with the suspend status and save it to the url variable. Afterwards I call the REST API to pause it. Lastly, I again print out a message based on the response from the REST API.

#Pause PBI Embedded capacity
azToken = get_az_token(tenant_id=tenant_id, client_id=client_id, client_secret=client_secret)
url = create_url(subscriptionId, resourceGroupName, capacity_name, 'suspend')
header = {'Content-Type':'application/json', 'Authorization':f'Bearer {azToken}'}
api_call = requests.post(url=url, headers=header)

if api_call.status_code == 202:
    print('Successfully changed status to suspend.')

if api_call.status_code == 400:
    print('An error occured. Probably the capacity is already in status paused.')

if api_call.status_code == 403:
    print('No sufficient permission to perform this action. Make sure the user has enough rights on Capacity or make sure the capacity ID is not pointing to the Power BI Service with the zeros GUID.')

Once the code is executed, it looks like the status of the capacity has changed.

Let’s again check in the Azure Portal.

After hitting the refresh button, I see the capacity is really paused – excellent!

With this piece of code, I can automatically assign workspaces based on my needs to a specific capacity! As I worked with an Embedded one, I even automatically started and paused the capacity through the REST API – awesome!

Please let me know if this post was helpful and give me some feedback. Also feel free to contact me if you have any questions.

If you’re interested in the files used in this blog check out my GitHub repo https://github.com/PBI-Guy/blog

How to use Incremental Refresh on ANY data source!

A few days ago, a colleague asked me if it would be possible to have more data from the Azure Cost Management API than only the last 30 days. Obviously, my first thought was sure, let’s use Azure Synapse and store it in a Data Lake. But then the real challenging question was asked: Would it be possible purely and only with Power BI, not with other services and tools? I was like: Let me brainstorm with my good colleague and co-organizer of the Power BI User Group Switzerland, Denis Selimovic. After a few minutes we (mainly him, but I’ll never admit it 😀 ) came up with the idea of using Datamarts as staging area and using Dataflows afterwards to enable Incremental Refresh. With this workaround, we’ll have an Azure SQL DB (this is technically a Datamart behind the scenes) as staging area, and therefore Incremental Refresh will work as Query folding will be possible! Denis already wrote a great article how to set it up for the Power BI Log Files, which only holds the last 30 days. Check it out here: https://whatthefact.bi/power-bi/power-bi-datamart/persisting-temporary-accessible-data-via-power-bi-datamarts-with-the-example-of-power-bi-activity-logs/ In my blog post I’m going to use a SharePoint site to test at the end the different scenarios (deleting, modifying, and adding new data). I just want to highlight one more time: This approach will work with any Data Source that Power Query / Datamart can connect to. So, it will also work with Excel Sheets, CSV files, BLOB, etc. What a game changer!

What is this Incremental Refresh, Query Folding, and why should I care?

Usually, if you connect to a data source with Power BI – and once your transformation and modelling is done – you set up an automatic refresh of the dataset. The beauty of this is, that all data will be refreshed every time. That works perfectly fine for small datasets. But what if you wish to only update the last few days because there is no need to refresh data from last years as those data never changes? For example, a sales report showing my sales from 2012 – 2022. Sales coming from the years 2012 – 2021 do not change usually so there is no need to update them on a regular base therefore we’re looking for a way to update only the last 7 days of 2022 in this example. This will speed up the Dataset refresh and that’s exactly what Incremental Refresh does. As creator of a dataset, you can set up how many days, months, or years you wish to refresh and everything older than that should just be stored. More insights about Incremental Refresh can be found here: https://docs.microsoft.com/en-us/power-bi/connect-data/incremental-refresh-overview

And how does Query Folding plays a role in this whole setup? Because we configure a specific date in our refresh (in our example we wish to refresh only the last 7 days of 2022), this date has to be provided somehow to the data source. If we’re talking in SQL, this means there has to be somewhere a WHERE clause filtering the data to the last 7 days. While Power BI connects to the data source, it tries to create Queries in the data source language (so if we connect to a SQL DB, it will talk SQL) and on top it tries to push all the different transformations that we did in Power Query to the data source. Again, as an example, if we rename a column from “Column A” to “Revenue” and our data source is SQL, it will generate something like SELECT [Column A] as [Revenue] so that SQL does the transformation. This is exactly what Query Folding is. It tries to push the transformations down to the data source. My friend and MVP Nikola Ilic did a great blog about Query Folding which you can find here: https://data-mozart.com/what-is-a-query-folding-in-power-bi-and-why-should-i-care/ or if you’re more interested in the Microsoft Docs following this link: https://docs.microsoft.com/en-us/power-query/query-folding-basics

Due to the fact that Incremental Refresh requires Query Folding to be able to get the latest data we’re looking for, not all data sources are supported. As an example, Excel, BLOB, CSV files, can’t be incrementally refreshed until now!

Power BI Datamarts

During Build 2022 in May, Microsoft announced a new artefact called Power BI Datamarts (see https://powerbi.microsoft.com/en-us/blog/democratize-enterprise-analytics-with-microsoft-power-bi/) to democratize enterprise analytics for everyone. With Datamarts, every user has an intuitive no code / low code database solution at hand as behind the scenes, an Azure SQL Database will be created.

A datamart creator can use the no code experience to extract, transform, and load data into a database that is fully managed by Power BI. There’s no need to worry about creating and managing dataflows or data refresh schedules—it’s all automatic. The user gets an intuitive SQL and visual querying interface for performing ad-hoc analysis on the data. Users can then connect to the datamart using external SQL-aware tools for further analysis.

Arun Ulagaratchagan

Therefore, we can connect to any data source, load it into a Datamart, and store it technically in a Database. Because now we have our data in our database, we can connect to it with a Dataflow and set up Incremental Refresh as Query Folding is now supported!

Let’s create a Datamart

As of today, Power BI Datamart is in Public Preview and a Premium feature so Premium, Premium per User, or Embedded is required. In my case I’m going to use a PPU license to create a Datamart. To be able to do so, I log in to PowerBI.com and select my demo workspace PBI Guy. In there, I choose New and select Datamart.

For the purpose of this blog post, I’m going to use a SharePoint list but as mentioned already, you can easily use something else like an Excel Sheet, CSV file, etc.

Therefore, I have to select Get data from another source and choose SharePoint Online list afterwards. Once selected, I provide my SharePoint site and my credentials, select my list, and hit transform data.

In Power Query Online I select only the needed columns (ID, Title, Date, and Revenue) and make sure that all data types are correct. As Incremental Refresh requires a DateTime column, please ensure your date column is set up correctly.

Once done, I select to load the data into my Datamart, and rename it on the next screen to “Staging Datamart” by selecting the arrow at the top.

Next, I create a Dataflow which should connect to my Datamart. Before I do so, I go back to my workspace, select the three dots besides my newly created Datamart, and hit Settings.

In there, I expand Server settings and copy the string.

Now I head back to my workspace, select New, and choose Dataflow.

On the next screen, I select Add new Table, and search for Azure SQL Database.

Once selected, I provide the copied Datamart (Azure SQL) string connection as Server name, select Authentication kind “Organizational account”, and select Next.

On the next screen, I select my table, and check in the Preview window if the data is correct. Once approved, I select Transform data.

In the Power Query Online experience, I don’t have to adjust anything anymore, but it would be possible if needed. Therefore, I just select Save & close, and save my Dataflow on the next screen with the name “Incremental Refresh”.

As next step, I have to configure Incremental Refresh. Luckily, this is pretty straight-forward. I just select the Incremental Refresh button, turn it on, and choose my Date column within the Dataflow as the DateTime column needed.

Lastly, I configure to store the past 3 years and only refresh the last 7 days. After hitting save I finished the configuration.

Once saved, a window pops up at the top right to Refresh the Dataflow now. I do so by selecting the button Refresh now to load the data into the Dataflow.

It’s time to test

Now that we have set up everything (connecting with a Datamart to our data source, connecting a Dataflow to our Datamart and setting up incremental refresh) let’s test if it works as expected. Today is the 14th of July 2022. In my demo list, I have some sales starting 1st of July until today. If I connect now with Power BI to my Dataflow, I see all five entries coming indirectly from SharePoint – so far so good.

Now, let’s do some changes in the SharePoint list. I will delete two rows, one from the 1st of July and one from the 11th of July. Further, I changed Product 2 name to Product 22 on the 4th of July and updated the Revenue on the 7th. Lastly, I added a new sale for today.

Our first step is now to trigger a refresh for our Datamart. Once the refresh successfully finished, we see a 1:1 copy of our SharePoint list.

Now, let’s trigger a refresh of our Dataflow. Once it’s finished, I hit the refresh button in my Power BI Desktop, which is connected to the Dataflow, to see the end result.

And as expected, Product 1 and 2 haven’t changed! So, we have now some historization in Power BI – awesome! But let’s analyze each row to understand the behavior.

Because we set up the Incremental Refresh to refresh only the last 7 days, everything prior to it will be ignored. Because Product 1 and 2 are older than 7 days, the changes didn’t affect our data in the Dataflow. But what about Product 3 which is dated 7th of July? This is, from an Incremental Refresh Point of view, 8 days ago because

  • 14. July = Day 1
  • 13. July = Day 2
  • 12. July = Day 3
  • 11. July = Day 4
  • 10. July = Day 5
  • 09. July = Day 6
  • 08. July = Day 7

and therefore, 7th July hasn’t been updated neither in our refresh. Product 4, which was dated on the 11th of July, has been removed – this is as expected. And lastly, our newest sale from today has been added (Product 6) which is also as expected.

Great, this is a real game changer as with Power BI you can now create a real staging area, and on top use Incremental Refresh to historize your data! But keep in mind, with this approach the data will only be available in the Dataflow. I would highly recommend using at least your own Azure Data Lake Storage Gen2 to store the Dataflow into it (see https://docs.microsoft.com/en-us/power-bi/transform-model/dataflows/dataflows-azure-data-lake-storage-integration). This way, you can access and enhance it if needed. Further, you can do backups and make sure it will not be lost if you delete your Dataflow.

Please let me know if this post was helpful and give me some feedback. Also feel free to contact me if you have any questions.

If you’re interested in the files used in this blog check out my GitHub repo https://github.com/PBI-Guy/blog

Power BI and Paginated Reports – beyond usual use

A lot of customers are asking me what are the differences between Power BI and Paginated Reports, why should they use one OR the other. My answer is mostly: It’s not one OR the other, why not combine and get the most out of both worlds?! I suggest in many cases that Power BI can be used as interactive dashboard “entry-tool” for end users to analyze dynamically their data. But once a pixel-perfect report should be created as PDF (it’s mostly PDF so we’re going to focus on this format) Paginated Reports are simply better. So why not creating a button within your Power BI report to take all the selected filters automatically and create out-of-the-box a Paginated Report PDF print-out? Most customers are first wondering that this kind of scenarios are possible and of course wondering how it can be done. Let me walk you through how to add such a button within a Power BI report in this blog post.

Prerequisites

  • Power BI Report
  • Paginated Report
  • Power BI Desktop
  • Power BI Report Builder (recommended)
  • Power BI Premium / Power BI Premium per User / Power BI Embedded
  • Basic understanding of both worlds

I already have a Power BI and a Paginated Report ready to combine it. If you’re not familiar how to create a Paginated Report or from where to get a simple demo file I can highly recommend the Power BI Paginated Reports in a Day Course. In this course you’ll learn the differences between Power BI and Paginated Reports, how to start and build your first report, and how to publish it afterwards to Power BI.

Further Paginated Reports are only supported with Premium. Therefore you will need a Power BI Premium capacity, Premium per Use license, or Power BI Embedded.

How to

The very first thing we need to do is to publish our Paginated Report to Power BI to get the unique ID of the report from the Service. In my case I open the RDL file with Power BI Report Builder and publish it to a workspace backed up with a PPU license. I name it Sales Analysis.

Once done the report will be available in Power BI Service. If we open it we’ll see the URL pointing to our specific workspace with a unique ID (1a8b6910-c4a2-4611-ae75-5d0b968eb6d3) and pointing to our Sales Analysis Paginated Report which has as well a unique ID (66a1a70a-89cf-4d48-80c1-39d766f9892b). This means we can use this URL to get to our just published Paginated Report.

If we check the Microsoft Documentation about Power BI and how the URL is build (see https://docs.microsoft.com/en-us/power-bi/paginated-reports/report-builder-url-parameters) we see that the URL can be enhanced to provide values for parameters, to provide commands to get a specific format, and many more. So before building something in our Power BI report let’s try the URL to understand what’s possible.

Let’s first try to give a value to the parameter. To initialize a parameter we have to add “?rp:parametername=value”. In our case the internal parameter name of the Paginated Report is called DateFiscalYear and can be checked in Power BI Report Builder. Checking the properties we also see that the parameter is a data type text.

If we’re looking for possible values we can check the “Available Values” and see if a query is used or something is hardcoded within the parameter settings. Alternatively we can also open the Report in Power BI Service and check the drop down list of the Parameter. If we do so we can see that following values are expected.

Let’s try to build the URL now with what we got so far:

URL to Reporthttps://msit.powerbi.com/groups/1a8b6910-c4a2-4611-ae75-5d0b968eb6d3/rdlreports/66a1a70a-89cf-4d48-80c1-39d766f9892b
Initializing Parameter?rp:
Parameter NameDateFiscalYear
Parameter ValueFY2019
Whole URLhttps://msit.powerbi.com/groups/1a8b6910-c4a2-4611-ae75-5d0b968eb6d3/rdlreports/66a1a70a-89cf-4d48-80c1-39d766f9892b?rp:DateFiscalYear=FY2019

If we call the URL now the parameter is automatically set to FY2019 and the report is loaded.

Let’s go further and try to get a PDF automatically. To do so we only need to add “&rdl:format=PDF” at the end of our URL. The “&” symbol combines different commands and to get a PDF automatically the rdl:format=PDF is necessary. Therefore our whole URL looks now as following:

https://msit.powerbi.com/groups/1a8b6910-c4a2-4611-ae75-5d0b968eb6d3/rdlreports/66a1a70a-89cf-4d48-80c1-39d766f9892b?rp:DateFiscalYear=FY2019&rdl:format=PDF

If we call this URL Power BI will automatically generate a PDF.

So far so good! Now that we understand how the URL of a Paginated Report works and how we can modify it let’s try to implement it in our Power BI Report.

After opening the Power BI Report in Power BI Desktop we can add a simply DAX measure with our hardcoded URL to call the Paginated Report.

Paginated Report URL = “https://msit.powerbi.com/groups/1a8b6910-c4a2-4611-ae75-5d0b968eb6d3/rdlreports/66a1a70a-89cf-4d48-80c1-39d766f9892b?rp:DateFiscalYear=FY2019&rdl:format=PDF”

Once added make sure to mark it as Data Category Web URL.

If we add now the measure to our report we see our hardcoded URL. If we click on it the Paginated Report will open. Unfortunately it’s not “connected” with our Power BI Report so far. Meaning if I change the Slicer for example to FY2020 the URL will still point to FY2019. Let’s fix this with some DAX magic.

I add a new Measure to get the selected value of the slicer. In this case I use following formula:

Selected Fiscal Year = SELECTEDVALUE(‘Date'[Fiscal Year])

Now I just replace the hardcoded FY2019 from the first Measure with my second Measure. The DAX Measure looks now as following:

Paginated Report URL = “https://msit.powerbi.com/groups/1a8b6910-c4a2-4611-ae75-5d0b968eb6d3/rdlreports/66a1a70a-89cf-4d48-80c1-39d766f9892b?rp:DateFiscalYear=” & KPIs[Selected Fiscal Year] & “&rdl:format=PDF”

Now every time I select another FY my URL will automatically adopt. That’s very simple with a single selection but what if I wish to have a multi selection, will it still work? Let’s try it out. But before testing the URL we need to make sure the Slicer is enabled for Multi Selection as well as the Parameter in our Paginated Report. Therefore I change the settings of both.

Don’t forget to republish the Paginated Report once the Property has been modified.

Let’s test our URL now in Power BI if we select two FY. I added the Paginated Report URL Measure into a Table visual to see it and select two different FY. Unfortunately the URL do not show both years, even worse it just disappeared. The reason behind is that the SELECTEDVALUE function expects one value.

Luckily we can also give an alternative to the SELECTEDVALUE function in which we can concatenate multiple values. To make sure we got the each value just once we need to use the DISTINCT function as well. Our Selected Fiscal Year Measure looks now as following.

Selected Fiscal Year = SELECTEDVALUE(‘Date'[Fiscal Year], CONCATENATEX(DISTINCT(‘Date'[Fiscal Year]), ‘Date'[Fiscal Year]))

Unfortunately it combines now FY2019 and FY2020 into one string and the URL contains now FY2019FY2020 which will not work. Even if we separate the two fiscal years with a comma or something else it will still not work as Paginated Report will recognize it as one value (e.g. “FY2019, FY2020” is one value and the report will not load). Therefore we need to add for each value the parameter again like in the Documentation described (see https://docs.microsoft.com/en-us/power-bi/paginated-reports/report-builder-url-parameters#url-access-syntax). The syntax looks as following:

powerbiserviceurl?rp:parametername=value&rp:parametername=value

In our case this means we have to have rp:DateFiscalYear=FY2019&rp:DateFiscalYear=FY2020 after the question mark. Let’s adjust our Selected Fiscal Year Measure to get the right URL needed. If we closely look to the syntax we see that the Delimiter can be specified. We’re going to use this and add “&rp:DateFiscalYear=”. In this case every time two ore more values are selected the values will be separated with the right expression. Our final DAX measure looks now as following:

Selected Fiscal Year = SELECTEDVALUE(‘Date'[Fiscal Year], CONCATENATEX(DISTINCT(‘Date'[Fiscal Year]), ‘Date'[Fiscal Year], “&rp:DateFiscalYear=”))

We can also see that the URL is changing dynamically based on the FY selection. If we click now on the URL the Paginated Report will open with the two FY selected and print out a PDF automatically.

Our last step is now to create a button in our Power BI Report and publish it afterwards.

In my case I choose the Pentagon Row shape and add it into my report. Of course you can modify it as wished or even use a visual instead of a shape / button to achieve the same result (open the paginated report).

Position the shape and configure it as needed. Lastly modify the Action property, set the Type to Web URL and configure our DAX Measure to be used as Web URL.

Now just publish the Power BI Report and use the button to open the Paginated Report based on your Slicer selection in Power BI.

Conclusion

As we see we can use Power BI as entry point and use it to set filters to open a Paginated Report afterwards. Due to the flexibility of the Paginated Report URL we can also specify in which format the report should be exported. This could also be a dynamic selection in Power BI. There are further integration possibilities thanks to the Paginated Report Visual in Power BI to display a Paginated Report directly in Power BI.

Please let me know if this post was helpful and give me some feedback. Also feel free to contact me if you have any questions.

If you’re interested in the files used in this blog check out my GitHub repo https://github.com/PBI-Guy/blog

Power BI Licensing

One of the most discussed topics with my customers and partners is Power BI licensing. Typical questions are

  • I want to create a report for my own use do I need a Power BI Pro license?
  • Does a report viewer also need a Power BI Pro license?
  • What if we have like 1000 Users does everybody need a Pro license?
  • What are the costs?

In this post I try to explain the different licensing options for Power BI. Further I’ll discuss some various scenarios and what kind of license would fit best.

First things first. We need to understand what kind of products Power BI has in his portfolio.

Power BI Products

Power BI Desktop

The Power BI Desktop is a client application in which you can author modern and interactive reports. You can save those files as a PBIX format. I’ll highly recommend to install and use it as you have the full flexibility to create your report and data model, and modify it as needed. For more information please visit https://powerbi.microsoft.com/en-us/desktop

Power BI Service

The Power BI Service is a cloud-based modern business analytics solution in which you can publish (PBIX files) or even create reports. Creating reports in the service is – as of today – limited comparing it to Power BI Desktop. For example you can’t use DAX to enhance your model in the browser. You can find more information on https://docs.microsoft.com/en-us/power-bi/service-get-started

Power BI Premium

Power BI Premium is a dedicated capacity for your organization. It has the same functionality as the Power BI Service but it gives you more consistent performance, larger data volumes, and the flexibility you need. See also https://powerbi.microsoft.com/en-us/power-bi-premium

Power BI Report Server

Instead of going to the cloud Power BI offers a on-premises Report Server on which you can publish and distribute your Power BI reports in-house. It does not have all services & features like the Power BI Service – like the natural Q&A – but most of it. Further information can be found here https://powerbi.microsoft.com/en-us/report-server

Power BI Embedded

If you would like to embed Power BI Reports in your own application then Power BI Embedded is the right choice. It’s designed for Independent Software Vendors (ISVs) and developers. More information can be found here https://powerbi.microsoft.com/en-us/power-bi-embedded

Power BI Mobile

Power BI Mobile offers you to connect to your data and see your reports on the go for any device. You can download the app from Microsoft, on the App Store, or Google Play. For more information please visit https://powerbi.microsoft.com/en-us/mobile

After we have clarified what kind of products are available let’s deep-dive into the different licensing options.

Power BI Licenses

Power BI Free

Power BI Desktop and Power BI Mobile are free for all users! Regardless of what other product (Power BI Service, Power BI Report Server, etc.) you are using those two are totally free. Further there is a limited Power BI Service free edition in which you can use following features: All Connectors, Publish to Web, and Export to PowerPoint, Excel, CSV. This means if I would like to create a report for myself I can download the Power BI Desktop, create a report, publish it to Power BI Service and use e.g. a Dashboard to combine different Reports. Further I can connect with my mobile device to Power BI Service and see my dashboard on the go. Awesome! The Power BI Free license is still required so an user can log in into the service. With the Power BI Free license Microsoft makes sure that the org admin has allowed access to Power BI Service in general for the specific user.

Power BI Pro

As mentioned Power BI Desktop and Power BI Mobile are free for all users but the Power BI Service free edition does not have all features covered. One of the most asked one is the “Peer-to-peer sharing” feature which allows me to share my Dashboards, Reports, and Datasets with other users. To be able to do so I, the author, have to have a Power BI Pro license regardless if my organization uses Power BI Service, Power BI Premium, Power BI Embedded, or Power BI Report Server. For the viewer of the report it depends what the company has decided to use. If Power BI Service is the chosen one then the viewer has to have a Power BI Pro License as well. If Power BI Premium or Power BI Report Server is in use than a consumer needs a Power BI Free License. Even if the License itself is free an administrator has to assign it to the user. For more information and a comparison between Free and Pro please visit https://docs.microsoft.com/en-us/power-bi/service-free-vs-pro

Power BI Premium

Power BI Premium is a capacity pricing variant. There are different sizes (cores) available. The Whitepaper can be downloaded here. Capacity pricing means that not all users need a License. Only the author has to have a Power BI Pro License. All viewers / consumers do not need a Pro License but the admin has still to assign a Free License to all needed users.

Power BI Premium per User

Power BI Premium Per User allows organizations to license Premium features on a per-user basis. Premium Per User (PPU) includes all Power BI Pro license capabilities, and also adds features such as paginated reports, AI, and other capabilities that are only available to Premium subscribers. More information can be found here: https://docs.microsoft.com/en-us/power-bi/admin/service-premium-per-user-faq

Power BI Report Server

An organization can purchase Power BI Report Server in two different ways: By using Power BI Premium you are also allowed to use Power BI Report Server or you have a SQL Server Enterprise Edition incl. Software Assurance. In both cases an author still needs a Power BI Pro License to share Power BI Reports. Viewers don’t need a license at all.

Power BI Embedded

With Power BI Embedded you are allowed to embed Power BI Reports into your own application. Depending on which License type (A, EM or P SKU) you are using viewers need a Power BI Free License assigned (EM or P SKU) or you have to manage authentication within your application (A SKU). In both cases an author still needs a Power BI Pro License to share reports. For more information please visit https://docs.microsoft.com/en-us/power-bi/developer/embedded-faq

Phu! That has been a lof of information! Let’s discuss now some various scenarios and see which Product would fit best and which License is needed.

Scenarios

Luke testing for himself

Let’s imagine Luke would like to build some Reports for himself. He would like to connect to different data sources like Excel, CSV, SQL Database and Google Analytics. Further he would like to build a Dashboard and connect to it with his tablet and mobile device.

In this case he will use Power BI Desktop to create and publish reports, Power BI Service to build Dashboards and Power BI Mobile to connect with his mobile device or tablet to his Dashboards. Everything is possible with the Power BI Free License.

Obi-Wan would like to see Luke’s Dashboard

Luke is so excited about Power BI and his Dashboard he would like to show it to Obi-Wan. Obi-Wan shouldn’t be able to change anything in the report therefore Luke wants to share it within the Power BI Service with him.

Luke and Obi-Wan will both use the Power BI Service and both need a Power BI Pro License to share and view the Dashboard.

Luke would like to leverage some Premium features and share it with Obi-Wan

Luke would like to enhance his report with some out-of-the-box AI capabilities that Power BI Premium offers. But just for the two of them it doesn’t make sense to purchase Power BI Premium. Therefore Luke decided to leverage the Power BI Premium per User license to get the Premium features like AI, paginated reports, and other capabilities.

Because Luke would like to leverage Premium features he need a Power BI Premium per User (PPU) license. Because he wishes to share it with Obi-Wan, he also needs a PPU license due to the fact that Premium features are used and a Pro license is not sufficient. The matrix below will clarify which license type can view / access what kind of content.

Chart of which users can see content based on license types

The Rebels are interested in Luke’s Dashboard

Luke and Obi-Wan are both so excited about the possibilities of Power BI that they are telling everybody about it. Therefore the interest is growing and nearly every Rebel would like to see Luke’s Dashboard. Because of the growing interest, the huge number of viewers, and the more and more complex Dashboards Luke thinks a dedicated capacity would make sense.

In this scenario Luke would go for Power BI Premium. This means he has to republish his report from Power BI Desktop to the Premium capacity (or assign the existing workspace to a Premium node) and make it available for all Rebels incl. Obi-Wan. Because the Rebels are now using a Premium capacity non viewer needs a Power BI Pro License but Luke has still to assign a Free License to each user. Instead of doing it for each user separately he decides that every user can sign up individually for Power BI (Settings in Power BI admin portal). This reduces the burden for Luke.

The Senators pass a new galaxy data protection regulation (GDPR)

The Galactic Senators pass a new law which strictly forbid to use and show personal data without the approval of the person itself. Luke doesn’t want to take any risks and decides to go on-premises instead of the cloud until the Rebels clarify if they are allowed to use all personal data.

Luke installs a Power BI Report Server on which he publish his Report from Power BI Desktop. Further he added all users to the Report Server, shares his Report, and deletes the Dashboard, Report and Datasets in Power BI Service and Power BI Premium to make sure everything is by law. In this case Luke needs a Power BI Pro License to share his report while all other users as viewers need only a Power BI Free License. Further because they already purchased Power BI Premium the Rebels are allowed to use the Power BI Report Server as well.

R2D2 should show Power BI Dashboards

Luke would like to enable R2D2 to show his Dashboard. To do so he goes for Power BI Embedded.

Because Luke would like to show his Dashboard on his own application (or android 🙂 ) he needs to have Power BI Embedded. Further he doesn’t need any Power BI Service graphic user interface (GUI) therefore the A SKU is enough. But Luke still needs a Power BI Pro License to be able to share his Dashboard with others while all viewers do not need any License at all this time.

Now that we clarified what kind of products and Service Power BI offers as well as how to license them properly let’s have a look at the cost. I’ll use list prices publicly available from the Power BI website. Keep in mind that the prices can change.

Power BI License Cost

Power BI Desktop

As mentioned during the post Power BI Desktop is absolutely free and can be used without any cost.

Power BI Mobile

The Power BI App for your mobile device is also free.

Power BI Free License

The Power BI Free license is, as the name says, as well free and has no costs.

Power BI Pro License

The Power BI Pro License costs $9.99/User/Month. This means if you have for example five users and everyone will require a Pro license your monthly cost will be $49.95$ for the five users.

The Pro license can be purchased as stand alone or through E5 as Power BI Pro is included in E5.

Power BI Premium per User

The PPU License costs $20/User/Month. If you already have a Pro License you just need the add-on which is $10/User/Month. Imagine having seven users with a Pro License and ten users with a Free License and all of them require now a PPU. In this case you would need to purchase the add-on for seven users (7x$10) and ten PPU stand alone Licenses (10x$20) which means you’ll have a total cost of $339.93 (7x$9.99 Pro License + 7x$10 Add-on + 10x$20)

Power BI Premium

If you’re interested in Power BI Premium the smallest SKU (P1 with 8 v-cores) costs $4’995.- per month. From a purely cost perspective this makes sense if you have 500 or more users. This 500 users break-even-point can be easily calculated by dividing the Premium costs by the Pro License costs: 4995 / 9.99 = 500. Keep in mind that there are more reasons to go for Premium than just cost!

Imagine if you have to share a report with 600 users. In such a scenario every user would require a Pro License if you share it through Power BI Service. Therefore the total cost for these 600 users would be $5’994.- per month (600x$9.99). As we see it would make more sense to purchase Power BI Premium and assign a Pro License just to the developers of the report (let’s say 10 developers). In this case the total cost would be $5’094.90 (10x$9.99 + $4’995) and we saved roughly $900 per month!

Power BI Report Server

Power BI Report Server is included in Power BI Premium or through SQL Server Enterprise Edition with SA. In the first case, included in Premium, the minimal cost is therefore $4’995.- per month (P1 SKU with 8 v-cores). Just to point out that if you purchase Power BI Premium P1 you can use Premium and install a Power BI Report Server on top of it 8 cores in-house and use in total 16 cores!

If you’re interested in SQL Server Enterprise Edition with SA best would be to contact your Microsoft representative.

Power BI Embedded

Power BI Embedded is a Microsoft Azure Service and will charge you as long as it runs. Once you stop the Service there are no costs at all. The smallest SKU A1 is roughly $740 per month if it runs 24/7. A detailed price list can be found at https://azure.microsoft.com/en-us/pricing/details/power-bi-embedded/

Conclusion

I think the most important information is regardless of which product you are using (Power BI Service, Premium, Report Server or Embedded) as soon as you would like to share a Report you will need a Power BI Pro License. For the viewer it depends on which product the report is published. In Power BI Service a viewer also needs a Power BI Pro License, in Premium and Report Server a Free License is enough. For an embedded scenario a Free (A SKU) or non License (EM or P SKU) is required. Lastly, if Power BI Premium per User license is used by the author all viewers will also require the PPU license.

To get a better overview of the estimated cost I created a Power BI Report which you can use to calculate your cost based on the number of Power BI Developers and Viewers. Keep in mind Power BI Premium offers more features and could be useful not only to save cost! Check it out here.

Please let me know if this post was helpful and give me some feedback. Also feel free to contact me if you have any questions.

If you’re interested in the files used in this blog check out my GitHub repo https://github.com/PBI-Guy/blog