How to extract data from the Fabric Metrics App – Part 2

In this mini series I’m walking you through how to extract data from the Fabric Metrics App to, for example, create a monthly chargeback report based on it. In my last blog post, I showed how to trace the required DAX Statement. In the second part, I will show how we can use Microsoft Fabric Notebooks and the DAX statement from Part 1 to extract the data and store them into OneLake. For that, I’ll follow the medallion Architecture (Bronze – Silver – Gold) to store and prepare the data.

Prerequisites

For this solution we need following services and licenses:

  • Microsoft Fabric or Power BI Premium Capacity
  • Workspace in a Fabric / Premium capacity
  • Lakehouse
  • Notebook
  • Python Skills

Let’s get started

My first action is to create a new Lakehouse in the Microsoft Fabric Capacity Metrics workspace which I call “FabricMetricsApp”. This will be used to store the output of the Metrics App. Important for this approach: create it in the Metrics App workspace as we’re going to connect to the Semantic Model via Python to it with Semantic Link.

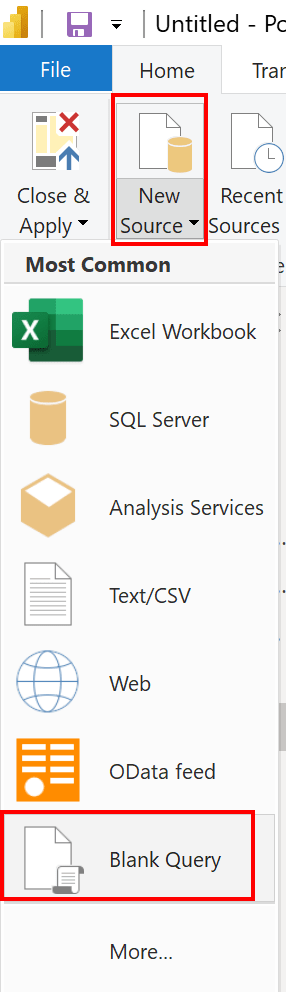
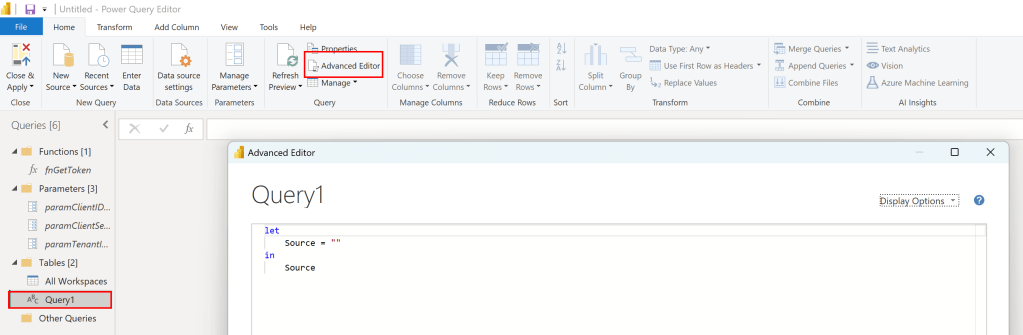
Next, I create a Notebook and as usual, I import the required libraries. On top, I also set the spark configuration following best practices. As bonus, I also configure the Power BI Catalog. This way, I can write SQL Statements on top of my Semantic Model if needed!

#Import required libraries

%pip install semantic-link
%load_ext sempy
import pandas as pd
import sempy.fabric as fabric
from datetime import date, datetime, timedelta
from pyspark.sql.types import StructType, StructField, StringType, IntegerType, FloatType, TimestampNTZType

spark.conf.set("sprk.sql.parquet.vorder.enabled", "true")
spark.conf.set("spark.microsoft.delta.optimizeWrite.enabled", "true")
spark.conf.set("spark.microsoft.delta.optimizeWrite.binSize", "1073741824")
spark.conf.set("spark.sql.catalog.pbi", "com.microsoft.azure.synapse.ml.powerbi.PowerBICatalog")

My next cell defines the required parameter. Here, I’m giving the Semantic Model (dataset) name, which is the given name of the Fabric Metrics App. The Semantic Model has different tables and one of them is called “Capacities” which lists all the capacities in the environment to which I have access to. This way, I could also loop through all capacities to extract the required data. Further, I’m defining a timepoint start date which is dynamically yesterday’s date. I’m also defining a bronze, silver, and gold layer files structure and add a DataFrame Schema at the end.

#Define required parameters
dataset = 'Fabric Capacity Metrics' #Default name of the Semantic Model
talbe_name = 'Capacities' #Table Name to get all Capacities
today = datetime.today() #Get Today's date
timepoint_start = today - timedelta(days=1) #Get yesterday's date on which we will extract all details
path_bronze = 'Files/01 Bronze/'
path_silver = 'Files/02 Silver/'
path_gold = 'Files/03 Gold/'
dataframe_schema = StructType([
                StructField("BillingType", StringType(), nullable=True),
                StructField("Status", StringType(), nullable=True),
                StructField("OperationStartTime", TimestampNTZType(), nullable=True),
                StructField("OperationEndTime", TimestampNTZType(), nullable=True),
                StructField("User", StringType(), nullable=True),
                StructField("Operation", StringType(), nullable=True),
                StructField("OperationID", StringType(), nullable=True),
                StructField("WorkspaceName", StringType(), nullable=True),
                StructField("Item", StringType(), nullable=True),
                StructField("ItemName", StringType(), nullable=True),
                StructField("TimepointCUs", FloatType(), nullable=True),
                StructField("DurationInS", IntegerType(), nullable=True),
                StructField("TotalCUInS", FloatType(), nullable=True),
                StructField("Throttling", IntegerType(), nullable=True),
                StructField("PercentageOfBaseCapacity", FloatType(), nullable=True),
                StructField("capacityId", StringType(), nullable=True),
                StructField("Timepoint", TimestampNTZType(), nullable=True),
                StructField("OperationType", StringType(), nullable=True)
            ])

In my third cell, I get all the capacities from the Semantic Model.

#Get all capacities
df_capacities = spark.sql("""
    SELECT c.capacityId

    FROM pbi.`""" + dataset + """`.Capacities c
""")

For testing purposes, I’m filtering the capacities down to just one in my next block of code. If you wish to get through all of your capacities, just remove the filter statement (line 3).

#For testing purpose filtering it down to only one capacity
capacity_id = '...'
df_capacities = df_capacities[df_capacities['capacityId'] == capacity_id]

display(df_capacities)

As next step, I create two functions – one for the background and one for the interactive operations – for reusability purpose. As this piece of code is quite huge, let me split it up in smaller junks.

First, I define the function for the background operation. The function itself requires two parameters – date and Capacity ID. I also add a small description of the function to document it.

def generate_dax_background_operation(date_today, capacity_id):
    """
    Generate the DAX statement which is used to get the background operations of the Metrics App for a given Capacity and day. 
    
    Arguments required: 
        date_today (datetime) - Date on which the background operation should be extracted
        capacity_id (string) - Capacity ID on which the background operation should be extracted

    Returns:
        DAX Statement (string)

    """

Next piece of code is to set the right starting timepoint. For that, I use the input parameter and set it to midnight. As I just want to test the code for a few timepoints, I’m replacing the timepoint_start with a hardcoded date. Obviously, this piece of code should be deleted.

    #timepoint_start = date_today.replace(hour=0, minute=0, second=0, microsecond=0) #Set timepoint to the beginning of the day
    timepoint_start = date_today.replace(day=25, month=3, year=2024, hour=16, minute=54, second=00, microsecond=00) #Use this timepoint to get a specific one - used for testing purpose
    timepoint_next = timepoint_start
    i = 0 #Initialising iteration count to check if all timepoints (2880 in total for a day) has been covered

Moving on, I need now a loop to go through from the first timepoint to the last one of the day. My logic checks if the current timepoint is still on the same day as the initial timepoint and if so, it will proceed. Again, as I’m just interested in a few timepoints, I hardcoded until when the loop should work. Lastly, I extract and convert the timepoint details like year, month, etc. into a string as I’ll need them later on.

    #while timepoint_next.day == timepoint_start.day: #As long as the day of the next timepoint is the same as start timepiont, loop will continue and add 30seconds at the end
    while timepoint_next <= datetime.strptime('25.03.2024 16:56:00', "%d.%m.%Y %H:%M:%S"): #Use this filter to get some specific timepoints only - used for testing purpose
        current_year = str(timepoint_next.year)
        current_month = str(timepoint_next.month)
        current_day = str(timepoint_next.day)
        starting_hour = str(timepoint_next.hour)
        starting_minutes = str(timepoint_next.minute)
        starting_seconds = str(timepoint_next.second)

My next parameter defines the DAX statement for the background operations. I’m making it as dynamic as possible to get the right data for the right timepoint. Remember, the DAX Statement was defined in the first part of this series.

        dax_background_operation = '''
                    DEFINE
                        MPARAMETER 'CapacityID' = "''' + capacity_id + '''"
                        MPARAMETER 'TimePoint' = (DATE(''' + current_year + ''', ''' + current_month + ''', ''' + current_day + ''') + TIME(''' + starting_hour + ''', ''' + starting_minutes + ''', ''' + starting_seconds + '''))

                        VAR varFilter_Capacity = TREATAS({"''' + capacity_id + '''"}, 'Capacities'[capacityId])	
                        VAR varFilter_TimePoint = 
                            TREATAS(
                                {(DATE(''' + current_year + ''', ''' + current_month + ''', ''' + current_day + ''') + TIME(''' + starting_hour + ''', ''' + starting_minutes + ''', ''' + starting_seconds + '''))},
                                'TimePoints'[TimePoint]
                            )		
                        VAR varTable_Details =
                            SUMMARIZECOLUMNS(
                                'TimePointBackgroundDetail'[OperationStartTime],
                                'TimePointBackgroundDetail'[OperationEndTime],
                                'TimePointBackgroundDetail'[Status],
                                'TimePointBackgroundDetail'[Operation],
                                'TimePointBackgroundDetail'[User],
                                'TimePointBackgroundDetail'[OperationId],
                                'TimePointBackgroundDetail'[Billing type],
                                'Items'[WorkspaceName],
                                'Items'[ItemKind],
                                'Items'[ItemName],
                                
                                varFilter_Capacity,
                                varFilter_TimePoint,
                                
                                "Timepoint CU (s)", SUM('TimePointBackgroundDetail'[Timepoint CU (s)]),
                                "Duration (s)", SUM('TimePointBackgroundDetail'[Duration (s)]),
                                "Total CU (s)", CALCULATE(SUM('TimePointBackgroundDetail'[Total CU (s)])),
                                "Throttling", CALCULATE(SUM('TimePointBackgroundDetail'[Throttling (s)])),
                                "% of Base Capacity", CALCULATE(SUM('TimePointBackgroundDetail'[% of Base Capacity]))
                            )
                                
                    EVALUATE  SELECTCOLUMNS(
                        varTable_Details,
                        "BillingType", [Billing type],
                        "Status", [Status],
                        "OperationStartTime", [OperationStartTime],
                        "OperationEndTime", [OperationEndTime],
                        "User", [User],
                        "Operation", [Operation],
                        "OperationID", [OperationId],
                        "WorkspaceName", [WorkspaceName],
                        "Item", [ItemKind],
                        "ItemName", [ItemName],
                        "TimepointCUs", [Timepoint CU (s)],
                        "DurationInS", [Duration (s)],
                        "TotalCUInS", [Total CU (s)],
                        "Throttling", [Throttling],
                        "PercentageOfBaseCapacity", [% of Base Capacity]	
                    )'''
        

Next, I want to evaluate the DAX statement and store the result into a DataFrame but only if the DataFrame is not empty and therefore having some results. I’m not interested in storing empty files. To make sure I can identify the capacity, timepoint, and operation type, I’m adding those fields to the DataFrame. Afterwards, I define the filename by using the timepoint name and save the result into OneLake using the date as subfolder name. This way I’m partitioning it already by day. Lastly, I add 30 seconds to the timepoint as Microsoft Fabric timepoints are calculated in 30 seconds junks and add a 1 to my i parameter to count how many runs have been made. This way, I can make sure that all timepoints have been evaluated.

As a timepoint consists of 30 seconds, a day has 2880 timepoints (2 timepoints per minute * 60 minutes * 24 hours = 2880)

        df_dax_result = fabric.evaluate_dax(
            dataset,
            dax_background_operation
            )
        
        df_dax_result['capacityId'] = capacity_id
        df_dax_result['Timepoint'] = timepoint_next
        df_dax_result['OperationType'] = 'background'

        #Set path and file name
        subfolder = str(timepoint_next.date()) + '/'
        file_name = timepoint_next.strftime("%H-%M-%S")

        #Convert Fabric DataFrames into Spark DataFrames
        df_dax_result_spark = spark.createDataFrame(df_dax_result, schema=dataframe_schema)

        #Save DataFrames to OneLake
        df_dax_result_spark.write.mode("overwrite").format("parquet").save(path_bronze + 'Background Operation/' + subfolder + file_name)
        
        #Don't change timepoint intervals, as 30sec intervals are given
        timepoint_next = timepoint_next + timedelta(seconds = 30)

        i = i + 1

    return i

To make sure the code is probably copied, here is the full cell.

#Create a function to get Background Operations of the Metrics App

def generate_dax_background_operation(date_today, capacity_id):
    """
    Generate the DAX statement which is used to get the background operations of the Metrics App for a given Capacity and day. 
    
    Arguments required: 
        date_today (datetime) - Date on which the background operation should be extracted
        capacity_id (string) - Capacity ID on which the background operation should be extracted

    Returns:
        DAX Statement (string)

    """

    #timepoint_start = date_today.replace(hour=0, minute=0, second=0, microsecond=0) #Set timepoint to the beginning of the day
    timepoint_start = date_today.replace(day=24, month=4, year=2024, hour=9, minute=00, second=00, microsecond=00) #Use this timepoint to get a specific one - used for testing purpose
    timepoint_next = timepoint_start
    i = 0 #Initialising iteration count to check if all timepoints (2880 in total for a day) has been covered

    #while timepoint_next.day == timepoint_start.day: #As long as the day of the next timepoint is the same as start timepiont, loop will continue and add 30seconds at the end
    while timepoint_next <= datetime.strptime('24.04.2024 09:02:00', "%d.%m.%Y %H:%M:%S"): #Use this filter to get some specific timepoints only - used for testing purpose
        current_year = str(timepoint_next.year)
        current_month = str(timepoint_next.month)
        current_day = str(timepoint_next.day)
        starting_hour = str(timepoint_next.hour)
        starting_minutes = str(timepoint_next.minute)
        starting_seconds = str(timepoint_next.second)

        dax_background_operation = '''
                    DEFINE
                        MPARAMETER 'CapacityID' = "''' + capacity_id + '''"
                        MPARAMETER 'TimePoint' = (DATE(''' + current_year + ''', ''' + current_month + ''', ''' + current_day + ''') + TIME(''' + starting_hour + ''', ''' + starting_minutes + ''', ''' + starting_seconds + '''))

                        VAR varFilter_Capacity = TREATAS({"''' + capacity_id + '''"}, 'Capacities'[capacityId])	
                        VAR varFilter_TimePoint = 
                            TREATAS(
                                {(DATE(''' + current_year + ''', ''' + current_month + ''', ''' + current_day + ''') + TIME(''' + starting_hour + ''', ''' + starting_minutes + ''', ''' + starting_seconds + '''))},
                                'TimePoints'[TimePoint]
                            )		
                        VAR varTable_Details =
                            SUMMARIZECOLUMNS(
                                'TimePointBackgroundDetail'[OperationStartTime],
                                'TimePointBackgroundDetail'[OperationEndTime],
                                'TimePointBackgroundDetail'[Status],
                                'TimePointBackgroundDetail'[Operation],
                                'TimePointBackgroundDetail'[User],
                                'TimePointBackgroundDetail'[OperationId],
                                'TimePointBackgroundDetail'[Billing type],
                                'Items'[WorkspaceName],
                                'Items'[ItemKind],
                                'Items'[ItemName],
                                
                                varFilter_Capacity,
                                varFilter_TimePoint,
                                
                                "Timepoint CU (s)", SUM('TimePointBackgroundDetail'[Timepoint CU (s)]),
                                "Duration (s)", SUM('TimePointBackgroundDetail'[Duration (s)]),
                                "Total CU (s)", CALCULATE(SUM('TimePointBackgroundDetail'[Total CU (s)])),
                                "Throttling", CALCULATE(SUM('TimePointBackgroundDetail'[Throttling (s)])),
                                "% of Base Capacity", CALCULATE(SUM('TimePointBackgroundDetail'[% of Base Capacity]))
                            )
                                
                    EVALUATE  SELECTCOLUMNS(
                        varTable_Details,
                        "BillingType", [Billing type],
                        "Status", [Status],
                        "OperationStartTime", [OperationStartTime],
                        "OperationEndTime", [OperationEndTime],
                        "User", [User],
                        "Operation", [Operation],
                        "OperationID", [OperationId],
                        "WorkspaceName", [WorkspaceName],
                        "Item", [ItemKind],
                        "ItemName", [ItemName],
                        "TimepointCUs", [Timepoint CU (s)],
                        "DurationInS", [Duration (s)],
                        "TotalCUInS", [Total CU (s)],
                        "Throttling", [Throttling],
                        "PercentageOfBaseCapacity", [% of Base Capacity]	
                    )'''
        
        df_dax_result = fabric.evaluate_dax(
            dataset,
            dax_background_operation
            )

        if not df_dax_result.empty:
        
            df_dax_result['capacityId'] = capacity_id
            df_dax_result['Timepoint'] = timepoint_next
            df_dax_result['OperationType'] = 'background'

            #Set path and file name
            subfolder = str(timepoint_next.date()) + '/'
            file_name = timepoint_next.strftime("%H-%M-%S")

            #Convert Fabric DataFrames into Spark DataFrames
            df_dax_result_spark = spark.createDataFrame(df_dax_result, schema=dataframe_schema)

            #Save DataFrames to OneLake
            df_dax_result_spark.write.mode("overwrite").format("parquet").save(path_bronze + 'Background Operation/' + subfolder + file_name)
            
        #Don't change timepoint intervals, as 30sec intervals are given
        timepoint_next = timepoint_next + timedelta(seconds = 30)

        i = i + 1

    return i

The next cell is going through the same logic but for interactive operations. Therefore, I’m just providing the full code.

#Create a function to get Interactive Operations of the Metrics App

def generate_dax_interactive_operation(date_today, capacity_id):
    """
    Generate the DAX statement which is used to get the interactive operations of the Metrics App for a given Capacity and day. 
    
    Arguments required: 
        date_today (datetime) - Date on which the interactive operation should be extracted
        capacity_id (string) - Capacity ID on which the interactive operation should be extracted

    Returns:
        DAX Statement (Pandas DataFrame)

    """

    #timepoint_start = date_today.replace(hour=0, minute=0, second=0, microsecond=0) #Set timepoint to the beginning of the day
    timepoint_start = date_today.replace(day=24, month=4, year=2024, hour=9, minute=00, second=00, microsecond=00) #Use this timepoint to get a specific one - used for testing purpose
    timepoint_next = timepoint_start
    i = 0 #Initialising iteration count to check if all timepoints (2880 in total for a day) has been covered

    #while timepoint_next.day == timepoint_start.day: #As long as the day of the next timepoint is the same as start timepoint, loop will continue and add 30seconds at the end
    while timepoint_next <= datetime.strptime('24.04.2024 09:02:00', "%d.%m.%Y %H:%M:%S"): #Use this filter to get some specific timepoints only - used for testing purpose
        current_year = str(timepoint_next.year)
        current_month = str(timepoint_next.month)
        current_day = str(timepoint_next.day)
        starting_hour = str(timepoint_next.hour)
        starting_minutes = str(timepoint_next.minute)
        starting_seconds = str(timepoint_next.second)

        dax_interactive_operation = '''
                    DEFINE
                        MPARAMETER 'CapacityID' = "''' + capacity_id + '''"
                        MPARAMETER 'TimePoint' = (DATE(''' + current_year + ''', ''' + current_month + ''', ''' + current_day + ''') + TIME(''' + starting_hour + ''', ''' + starting_minutes + ''', ''' + starting_seconds + '''))

                        VAR varFilter_Capacity = TREATAS({"''' + capacity_id + '''"}, 'Capacities'[capacityId])	
                        VAR varFilter_TimePoint = 
                            TREATAS(
                                {(DATE(''' + current_year + ''', ''' + current_month + ''', ''' + current_day + ''') + TIME(''' + starting_hour + ''', ''' + starting_minutes + ''', ''' + starting_seconds + '''))},
                                'TimePoints'[TimePoint]
                            )		
                        VAR varTable_Details =
                            SUMMARIZECOLUMNS(
                                'TimePointInteractiveDetail'[OperationStartTime],
                                'TimePointInteractiveDetail'[OperationEndTime],
                                'TimePointInteractiveDetail'[Status],
                                'TimePointInteractiveDetail'[Operation],
                                'TimePointInteractiveDetail'[User],
                                'TimePointInteractiveDetail'[OperationId],
                                'TimePointInteractiveDetail'[Billing type],
                                'Items'[WorkspaceName],
                                'Items'[ItemKind],
                                'Items'[ItemName],
                                
                                varFilter_Capacity,
                                varFilter_TimePoint,
                                
                                "Timepoint CU (s)", SUM('TimePointInteractiveDetail'[Timepoint CU (s)]),
                                "Duration (s)", SUM('TimePointInteractiveDetail'[Duration (s)]),
                                "Total CU (s)", CALCULATE(SUM('TimePointInteractiveDetail'[Total CU (s)])),
                                "Throttling", CALCULATE(SUM('TimePointInteractiveDetail'[Throttling (s)])),
                                "% of Base Capacity", CALCULATE(SUM('TimePointInteractiveDetail'[% of Base Capacity]))
                            )
                                
                    EVALUATE  SELECTCOLUMNS(
                        varTable_Details,
                        "BillingType", [Billing type],
                        "Status", [Status],
                        "OperationStartTime", [OperationStartTime],
                        "OperationEndTime", [OperationEndTime],
                        "User", [User],
                        "Operation", [Operation],
                        "OperationID", [OperationId],
                        "WorkspaceName", [WorkspaceName],
                        "Item", [ItemKind],
                        "ItemName", [ItemName],
                        "TimepointCUs", [Timepoint CU (s)],
                        "DurationInS", [Duration (s)],
                        "TotalCUInS", [Total CU (s)],
                        "Throttling", [Throttling],
                        "PercentageOfBaseCapacity", [% of Base Capacity]	
                    )'''
        
        df_dax_result = fabric.evaluate_dax(
            dataset,
            dax_interactive_operation
            )
        
        if not df_dax_result.empty:

            df_dax_result['capacityId'] = capacity_id
            df_dax_result['Timepoint'] = timepoint_next
            df_dax_result['OperationType'] = 'interactive'
            
            #Set path and file name
            subfolder = str(timepoint_next.date()) + '/'
            file_name = timepoint_next.strftime("%H-%M-%S")

            #Convert Fabric DataFrames into Spark DataFrames
            df_dax_result_spark = spark.createDataFrame(df_dax_result, schema=dataframe_schema)

            #Save DataFrames to OneLake
            df_dax_result_spark.write.mode("overwrite").format("parquet").save(path_bronze + 'Interactive Operation/' + subfolder + file_name)

        #print(i, timepoint_next, "interactive")
        
        #Don't change timepoint intervals, as 30sec intervals are given
        timepoint_next = timepoint_next + timedelta(seconds = 30)

        i = i + 1

    return i

After the two functions have been created, they have to be called. This is what I do in my next piece of code. I also store the iteration number into a parameter which I can check if all timepoints have been extracted for the two different operation types.

#Get for each capacity background and interactive operations
for row in df_capacities.toLocalIterator():
    capacity_id = row['capacityId']
    
    i_background = generate_dax_background_operation(timepoint_start, capacity_id)
    i_interactive = generate_dax_interactive_operation(timepoint_start, capacity_id)

Once the data is extracted into separate files for each timepoint, I’m reading the whole folder for a day to combine all timepoint files into one and store the result into the silver layer.

#Set Subfolder and file name
subfolder = str(timepoint_start.date()) + '/'
file_name = str(timepoint_start.date())

#Read folder
df_background_bronze = spark.read.parquet(path_bronze + 'Background Operation/' + subfolder + '/*')
df_interactive_bronze = spark.read.parquet(path_bronze + 'Interactive Operation/' + subfolder + '/*')

#Save DataFrames to OneLake Silver layer
df_background_bronze.write.mode("overwrite").format("parquet").save(path_silver + 'Background Operation/' + file_name)
df_interactive_bronze.write.mode("overwrite").format("parquet").save(path_silver + 'Interactive Operation/' + file_name)

Next, I read the data from the silver layer and combine the background and interactive operations into one file saving it into the Gold Layer.

#Read folder from Silver layer
df_background_silver = spark.read.parquet(path_silver + 'Background Operation/' + file_name)
df_interactive_silver = spark.read.parquet(path_silver + 'Interactive Operation/' + file_name)

#Combine background and interactive operations into one DataFrame
df_all_operations = df_background_silver.unionByName(df_interactive_silver)

#Save DataFrame into Gold Layer of OneLake
df_all_operations.write.mode("overwrite").format("delta").save(path_gold + file_name)

Now, I just read the file from the Gold layer and save the result as table within my Lakehouse. This way I make sure Power BI can consume the data. Keep in mind, I’m appending the result to the table to make sure I’m not losing any history. If you run the code twice within a day, you will have duplicates in your Table!

df_all_operations_gold = spark.read.parquet(path_gold + file_name)
df_all_operations_gold.write.mode("append").format("delta").save('Tables/AllOperations')

And that’s it! I extracted now the Metrics App data and stored it into my Lakehouse. Of course, I could create further Tables (e.g. Capacities), create a Semantic Model, and build a report on top!

Please let me know if this post was helpful and give me some feedback. Also feel free to contact me if you have any questions.

If you’re interested in the files used in this blog check out my GitHub repo https://github.com/PBI-Guy/blog

How to extract data from the Fabric Metrics App – Part 1

In recent discussions with my customers about Microsoft Fabric, the questions pops up how to create an internal and fair charge-back mechanism. There are different possibilities, from user-based, item-based, or usage-based scenarios, which you can leverage. From my point of view, the usage-based model would be the fairest one. In such a scenario, creators of items are eager to optimize their workload to reduce the usage on a capacity and therefore save some cost. But how can you create such a charge-back report? Let me walk you through in a this blog post how to set the basics and in my next one how a possible solution can look like.

Prerequisites

To be able to collect the necessary data and create a charge-back report, we will need some tools and items.

Let’s get started

The Fabric Capacity Metrics App is the best way to get an overview of who created how much load with which items on your capacity. The Microsoft documentation shows how easy it is to install and use it. Once installed, I switch to the Workspace called Microsoft Fabric Capacity Metrics and change the workspace settings to assign a capacity to the workspace. In my case, I use a Fabric one but a Premium, Premium per User, or Embedded would work as well.

Once done, I refresh the Semantic Model and open the report afterwards. Now, I have already an overview of the usage of the last 14 days. I would be able to filter now for example on a specific day to see what kind of items have produced how much load. But as I wish to have in detail who created the load, I need to drill-down to a specific data point. For that, I select on the top right visual a data point and hit the Explore button.

On the next page, I have a good overview of all interactive and background operations that have happened on my capacity (the two table visuals in the middle). If you’re interested in what kind of operations are considered as interactive resp. background, feel free to check the Microsoft documentation.

The issue right now is that on one hand we have only the last 14 days data and usually a monthly charge-back report is needed. An on the other hand, the details are only per Timepoint, which is a 30 second interval, available. Therefore, I need to extract the data to have a longer history and do that for each timepoint of the day. Let me start with extracting the data first.

Capture the DAX statement

I could connect with DAX Studio to the Semantic Model as the workspace is sitting now in a capacity and try to write my own DAX statement to get the required details. But as I’m efficient (not lazy as Patrick LeBlanc from Guy in a Cube says ;)), I’ll capture rather the DAX statement and adjust it if needed. To do so, I’ll use the SQL Profiler and connect to the Semantic Model. To get the connection string, I switch back to the Workspace settings, select Premium, and scroll down until I see the connection string. By hitting the button to the right, I copy it.

Now, I open SQL Server Profiler and put the connection string as Server name, select Azure Active Directory – Universal with MFA as authentication method, put in my mail as User name and hit Options.

Once the window extends, I select Connection Properties, specify Fabric Capacity Metrics as database to which I wish to connect, and hit Connect.

On the next screen, I go directly to Events Selection at the top, extend Queries Events, and select Query Begin and Query End.

With that, I’m prepared to capture the DAX query but I don’t hit Run yet. I wish to make sure to get the right query so I switch back to the Power BI Report and enter the edit mode. Now, I just delete all the visuals except the Interactive Operations table. This way, I make sure no other query is executed and I capture only what I need.

Once prepare, I switch back to SQL Profiler and hit Run.

After our tracer is running, I switch one more time back to the Power BI Report and hit the refresh button at the top right.

Now I see two operations in my Tracer – Query Begin and Query End. If I select one of it, I have now the DAX Query for the interactive Operations.

DEFINE
	MPARAMETER 'CapacityID' = 
		"9C3E7404-D2DA-4CB6-B93F-9873BDD3D95A"

	MPARAMETER 'TimePoint' = 
		(DATE(2024, 3, 20) + TIME(15, 59, 0))

	VAR __DS0FilterTable = 
		TREATAS({"9C3E7404-D2DA-4CB6-B93F-9873BDD3D95A"}, 'Capacities'[capacityId])

	VAR __DS0FilterTable2 = 
		TREATAS({"Dataset"}, 'Items'[ItemKind])

	VAR __DS0FilterTable3 = 
		TREATAS(
			{(DATE(2024, 3, 20) + TIME(15, 59, 0))},
			'TimePoints'[TimePoint]
		)

	VAR __DS0Core = 
		SUMMARIZECOLUMNS(
			ROLLUPADDISSUBTOTAL(
				ROLLUPGROUP(
					'TimePointInteractiveDetail'[OperationStartTime],
					'TimePointInteractiveDetail'[OperationEndTime],
					'TimePointInteractiveDetail'[Status],
					'TimePointInteractiveDetail'[Operation],
					'TimePointInteractiveDetail'[User],
					'TimePointInteractiveDetail'[OperationId],
					'TimePointInteractiveDetail'[Billing type],
					'TimePointInteractiveDetail'[Start],
					'TimePointInteractiveDetail'[End],
					'Items'[IsVirtualArtifactName],
					'Items'[IsVirtualWorkspaceName],
					'Items'[WorkspaceName],
					'Items'[ItemKind],
					'Items'[ItemName]
				), "IsGrandTotalRowTotal"
			),
			__DS0FilterTable,
			__DS0FilterTable2,
			__DS0FilterTable3,
			"SumTimepoint_CU__s_", CALCULATE(SUM('TimePointInteractiveDetail'[Timepoint CU (s)])),
			"SumThrottling__s_", CALCULATE(SUM('TimePointInteractiveDetail'[Throttling (s)])),
			"SumDuration__s_", CALCULATE(SUM('TimePointInteractiveDetail'[Duration (s)])),
			"SumTotal_CU__s_", CALCULATE(SUM('TimePointInteractiveDetail'[Total CU (s)])),
			"Sumv__of_Base_Capacity", CALCULATE(SUM('TimePointInteractiveDetail'[% of Base Capacity]))
		)

	VAR __DS0PrimaryWindowed = 
		TOPN(
			502,
			__DS0Core,
			[IsGrandTotalRowTotal],
			0,
			[SumTimepoint_CU__s_],
			0,
			'TimePointInteractiveDetail'[Billing type],
			0,
			'TimePointInteractiveDetail'[OperationStartTime],
			1,
			'TimePointInteractiveDetail'[OperationEndTime],
			1,
			'TimePointInteractiveDetail'[Status],
			1,
			'TimePointInteractiveDetail'[Operation],
			1,
			'TimePointInteractiveDetail'[User],
			1,
			'TimePointInteractiveDetail'[OperationId],
			1,
			'TimePointInteractiveDetail'[Start],
			1,
			'TimePointInteractiveDetail'[End],
			1,
			'Items'[IsVirtualArtifactName],
			1,
			'Items'[IsVirtualWorkspaceName],
			1,
			'Items'[WorkspaceName],
			1,
			'Items'[ItemKind],
			1,
			'Items'[ItemName],
			1
		)

EVALUATE
	__DS0PrimaryWindowed

ORDER BY
	[IsGrandTotalRowTotal] DESC,
	[SumTimepoint_CU__s_] DESC,
	'TimePointInteractiveDetail'[Billing type] DESC,
	'TimePointInteractiveDetail'[OperationStartTime],
	'TimePointInteractiveDetail'[OperationEndTime],
	'TimePointInteractiveDetail'[Status],
	'TimePointInteractiveDetail'[Operation],
	'TimePointInteractiveDetail'[User],
	'TimePointInteractiveDetail'[OperationId],
	'TimePointInteractiveDetail'[Start],
	'TimePointInteractiveDetail'[End],
	'Items'[IsVirtualArtifactName],
	'Items'[IsVirtualWorkspaceName],
	'Items'[WorkspaceName],
	'Items'[ItemKind],
	'Items'[ItemName]

I could use this query already and execute it in DAX Studio – just to make sure it works as expected.

Make sure to remove the [WaitTime: 0 ms] at the end of the query if you’re copying it from SQL Profiler.

Looks good! I repeat the same steps for the background operations and test is as well in DAX Studio. Once done, I close SQL Server Profiler as tracing is not necessary anymore.

As a next step, let me analyze the generated query and optimize it. I will start this time with the background operations. The first variable defined is a MPARAMETER for the Capacity ID. The second one is as well a MPARAMETER for the Timepoint including the conversion. MPARAMETERS are so-called binding parameters which are passed through from the Power BI report to Power Query. DAX.guide has a great explanation and example here: https://dax.guide/st/mparameter/ This means we have to pass those two values to retrieve the correct result.

Going further, three different variables are defined which are used later on to filter. We have again the Capacity ID, Timepoint, and an Item filter to get only Datasets. As I don’t need the Item filter, I just delete it. For readability reasons, I also renamed the other two variables going from __DS0FilterTable to varFilter_Capacity and from DS0FilterTable3 to varFilter_TimePoint.

My first block of DAX looks like this.

DEFINE
	MPARAMETER 'CapacityID' = 
		"9C3E7404-D2DA-4CB6-B93F-9873BDD3D95A" --add your capacity ID here

	MPARAMETER 'TimePoint' = 
		(DATE(2024, 3, 20) + TIME(15, 59, 0))

	VAR varFilter_Capacity = 
		TREATAS({"9C3E7404-D2DA-4CB6-B93F-9873BDD3D95A"}, 'Capacities'[capacityId]) --add your capacity ID here

	VAR varFilter_TimePoint = 
		TREATAS(
			{(DATE(2024, 3, 20) + TIME(15, 59, 0))},
			'TimePoints'[TimePoint]
		)

Replace the three dots with your Capacity ID.

The next big block is a simple group by logic based on different columns and summarizes different KPIs on top. I simplify and store it as well into a variable.

VAR varTable_Details =
		SUMMARIZECOLUMNS(
			'TimePointBackgroundDetail'[OperationStartTime],
			'TimePointBackgroundDetail'[OperationEndTime],
			'TimePointBackgroundDetail'[Status],
			'TimePointBackgroundDetail'[Operation],
			'TimePointBackgroundDetail'[User],
			'TimePointBackgroundDetail'[OperationId],
			'TimePointBackgroundDetail'[Billing type],
			'Items'[WorkspaceName],
			'Items'[ItemKind],
			'Items'[ItemName],
			
			varFilter_Capacity,
			varFilter_TimePoint,
			
			"Timepoint CU (s)", SUM('TimePointBackgroundDetail'[Timepoint CU (s)]),
			"Duration (s)", SUM('TimePointBackgroundDetail'[Duration (s)]),
			"Total CU (s)", CALCULATE(SUM('TimePointBackgroundDetail'[Total CU (s)])),
			"Throttling", CALCULATE(SUM('TimePointBackgroundDetail'[Throttling (s)])),
			"% of Base Capacity", CALCULATE(SUM('TimePointBackgroundDetail'[% of Base Capacity]))
		)

Lastly, we need an EVALUATE to get a result.

EVALUATE  SELECTCOLUMNS(
    varTable_Details,
    "BillingType", [Billing type],
    "Status", [Status],
    "OperationStartTime", [OperationStartTime],
    "OperationEndTime", [OperationEndTime],
    "User", [User],
    "Operation", [Operation],
    "OperationID", [OperationId],
    "WorkspaceName", [WorkspaceName],
    "Item", [ItemKind],
    "ItemName", [ItemName],
    "TimepointCUs", [Timepoint CU (s)],
    "DurationInS", [Duration (s)],
    "TotalCUInS", [Total CU (s)],
    "Throttling", [Throttling],
    "PercentageOfBaseCapacity", [% of Base Capacity]	
)

This way, we have now an optimized and more readable DAX statement for the Background operations. To get the same optimized query for interactive operations, I only need to replace the TimePointBackgroundDetail table with TimePointInteractiveDetail and I’m already good to go! The whole DAX statement can be found in my GitHub repo.

Now, we have everything on hand to extract the required details on a – for example – daily base. There are various options to achieve it – from Power Automate Flows, to Microsoft Fabric Pipelines, and / or Python Notebooks (Databricks or Microsoft Fabric), and many more. In my next blog post, I’ll walk you through one possible option to store the data into OneLake.

Please let me know if this post was helpful and give me some feedback. Also feel free to contact me if you have any questions.

If you’re interested in the files used in this blog check out my GitHub repo https://github.com/PBI-Guy/blog

Export Power BI Reports as PDF via REST API

It’s been a while since my last post as a lot is going on and I had the pleasure to realize some really interesting projects in the past. One of them was to use the Power BI REST API to download Power BI Paginated Reports as PDF locally to a PC. And this is exactly what I will walk you through in this blog post.

Prerequisites

To be able to export reports programmatically, there are some things needed:

  • Power BI report (it works the same for Power BI or Paginated Reports)
  • Power BI Capacity (either Premium, Embedded, or Fabric)
  • Service Principal with sufficient permission
  • Python skills
  • Tool to write / execute Python code (in my case Visual Studio Code)

Setting the scene

I have a Power BI Workspace assigned to a Power BI Embedded capacity, which has to run during the whole time otherwise I won’t be able to call the Power BI REST API. Further, I have obviously a Power BI Paginated Report to be able to export it to a PDF. In my case, I use the Sales Analysis report which is used as example for the Paginated Report in a Day course. I like this one as it’s simple and uses one Parameter Fiscal Year, which we can also influence during our REST API call.

Let’s code

As usual, the first step working with Python is to import the required libraries. In this case, I’m going to use following ones.

#Import needed libraries
import requests
import json
import pandas as pd
import msal
import os

In my next cell, I specify the required parameters for my Service Principal (if you need to know how to create one, check out this guide here: https://pbi-guy.com/2022/03/10/power-bi-and-activity-logs-with-python/) to be able to authenticate as well as the Workspace, Report ID, and some others. My last parameter will be my local path in which I wish to save the PDF(s).

#Specify Parameters

#Service Principal
client_id = ''
client_secret = ''

#Tenant Specification
tenant_id = ''
authority_url = 'https://login.microsoftonline.com/' + tenant_id
scope = ['https://analysis.windows.net/powerbi/api/.default']

#Report Specification
workspace_id = ''
report_id = ''
dataset_id = ''
base_url = 'https://api.powerbi.com/v1.0/myorg/groups/' + workspace_id + '/reports/' + report_id
format = 'PDF'
body = {

    "format": format
}

#Report File Specification
path = ''

As you probably noticed, there is a Parameter called “format” in which I specify the wished file format (PDF in this case). If you wish to export the reports in another format, you just need to overwrite this specific parameter for example to XLSX or DOCX, depending on your needs.

Now, that we specified all required parameters, we can first authenticate against Power BI Service with our Service Principal. For that, I use following code.

#Use MSAL to grab token
app = msal.ConfidentialClientApplication(client_id, authority=authority_url, client_credential=client_secret)
result = app.acquire_token_for_client(scopes=scope)

if 'access_token' in result:
    access_token = result['access_token']
    header = {'Content-Type':'application/json', 'Authorization':f'Bearer {access_token}'}

Next, we would be able to call the Power BI REST API call to export reports as PDF. Checking the documentation, it highlights that the API is asynchronous. When the API is called, it triggers an export job. After triggering an export job, use GetExportToFileStatus API to track the job status. Read more about the entire flow: Export Power BI reports and Export Paginated reports

This means we need to first call the Export API to trigger an export job. Afterwards, we need to check the status of the export by calling the /exports/{id} API and if succeeded, then we can get and save the file finally.

As I have to make a post resp. get request multiple times, I create in my next cell a function to easy up my life to not write the almost same code over and over again.

#Define Request Functions

#Post Reuqest
def post_request(url, header, body):
    api_call = requests.post(url=url, headers=header, json=body)
    return api_call

#Get Request
def get_request(url, header):
    api_call = requests.get(url=url, headers=header)
    return api_call

Because in my case I have a Paginated Report with Parameters, I’d like to dynamically get all values (Fiscal Year) and create for each year one PDF. If a new year will be added in future, the script should automatically detect that and create a PDF on top of it. For that purpose, I call the Execute Queries REST API to execute a DAX statement to get all Fiscal Year values out of my underlying dataset. Because I created a function in my previous cell, I can just call the post_request function and pass the required parameters to it. Lastly, I have to extract, format, and convert the Fiscal Year values into a Pandas Dataframe. To be sure I got all the values, I print them.

#Execute DAX Statement to get full list for Report Parameter
url_execute_query = "https://api.powerbi.com/v1.0/myorg/groups/" + workspace_id + "/datasets/" + dataset_id + "/executeQueries"
dax = "EVALUATE VALUES('Date'[Fiscal Year])"
query = '{"queries": [{"query": "' + dax + '"}], "serializerSettings": {"includeNulls": "true"}}'
body = json.loads(query)
api_call = post_request(url_execute_query, header, body)

#Transform to Pandas Dataframe
result = api_call.content.decode('utf-8-sig')
result = result.replace('"results":[{', '')
result = result[:len(result)-2]
result = result.replace('"tables":[{', '')
result = result[:len(result)-2]
result = result.replace('"rows":[{', '')
result = result[:len(result)-1]
result = '[' + result
result = json.loads(result)
df_result = pd.DataFrame(result)
df_result = df_result.rename(columns={'Date[Fiscal Year]': 'Fiscal Year'})

print(df_result)

As we can see, I have six Fiscal Year values from 2017 – 2022.

As a next step, we need to call now the /ExportTo API for each Fiscal Year. Thus, I create a for each loop based on the Fiscal Year Dataframe (df_result). As we have to provide a body context in which we can specify the format as well as influence the parameters, I do specifically that. As a response to the call, we get a Export ID which we need later on to be able to export and save the report as PDF. Therefore, I store all of them in one Dataframe called df_export and print it out to make sure I get it for each Fiscal Year.

#Export Report for each value in Report Parameter
export_url = base_url + '/ExportTo'
export_id_list = []
parameter_value_list = []

for index, row in df_result.iterrows():
    current_value = df_result['Fiscal Year'][index]
    body = {
        "format": format,
        "paginatedReportConfiguration": {
            "parameterValues":[
                    {"name": "DateFiscalYear", "value": current_value}
                ]
        }
    }

    api_call = post_request(export_url, header, body)
    export_id = api_call.json()['id']
    export_id_list.append(export_id)
    parameter_value_list.append(current_value)

df_export = pd.DataFrame(list(zip(export_id_list, parameter_value_list)), columns=['Export ID', 'Parameter Value'])
print(df_export)

After we initiated the export for each Fiscal Year, we have to check the status. For that, I created again a for each loop based on the df_export Dataframe this time and check for each Export ID if the status is “Succeeded”. Until then, I print out the current Fiscal Year as well as the current status to have an overview of the current state.

#Get Export Status

for index, row in df_export.iterrows():
    current_export_id = df_export['Export ID'][index]
    current_parameter_value = df_export['Parameter Value'][index]

    url_status = base_url + '/exports/' + current_export_id
    status = ''
    while status != 'Succeeded':
        api_call = get_request(url_status, header)
        status = api_call.json()['status']
        print(status)
        print(current_parameter_value)

Once done, we can finally save our PDF as wished. As I save it in my case on my local machine, I use the os library but obviously you can save the PDF wherever you wish, for example in OneLake, ADLS Gen2, SharePoint, etc. To be able to do that, I once more created a for each loop on the df_export Dataframe and call the /exports/{id}/file API where {id} represents the Export ID from our previous step. Once I got the content, I save it to my local machine. By the way, I influence the file name by providing the current Fiscal Year value (see parameter file_name).

#Save report as PDF

for index, row in df_export.iterrows():
    current_export_id = df_export['Export ID'][index]
    file_name = df_export['Parameter Value'][index]

    url_save = base_url + '/exports/' + current_export_id + '/file'
    api_call = get_request(url_save, header)

    completename = os.path.join(path, file_name + '.' + format)

    with open(completename, 'wb') as f:
        f.write(api_call.content)

As a final result, we get for each Fiscal Year one PDF saved to our local machine!

The whole code looks as now as following.

#Import needed libraries
import requests
import json
import pandas as pd
import msal
import os

#Specify Parameters

#Service Principal
client_id = ''
client_secret = ''

#Tenant Specification
tenant_id = ''
authority_url = 'https://login.microsoftonline.com/' + tenant_id
scope = ['https://analysis.windows.net/powerbi/api/.default']

#Report Specification
workspace_id = ''
report_id = ''
dataset_id = ''
base_url = 'https://api.powerbi.com/v1.0/myorg/groups/' + workspace_id + '/reports/' + report_id
format = 'PDF'
body = {

    "format": format
}

#Report File Specification
path = ''

#Use MSAL to grab token
app = msal.ConfidentialClientApplication(client_id, authority=authority_url, client_credential=client_secret)
result = app.acquire_token_for_client(scopes=scope)

if 'access_token' in result:
    access_token = result['access_token']
    header = {'Content-Type':'application/json', 'Authorization':f'Bearer {access_token}'}
	
#Export Report for each value in Report Parameter
export_url = base_url + '/ExportTo'
export_id_list = []
parameter_value_list = []

for index, row in df_result.iterrows():
    current_value = df_result['Fiscal Year'][index]
    body = {
        "format":"PDF",
        "paginatedReportConfiguration": {
            "parameterValues":[
                    {"name": "DateFiscalYear", "value": current_value}
                ]
        }
    }

    api_call = post_request(export_url, header, body)
    export_id = api_call.json()['id']
    export_id_list.append(export_id)
    parameter_value_list.append(current_value)

df_export = pd.DataFrame(list(zip(export_id_list, parameter_value_list)), columns=['Export ID', 'Parameter Value'])
print(df_export)

#Get Export Status

for index, row in df_export.iterrows():
    current_export_id = df_export['Export ID'][index]
    current_parameter_value = df_export['Parameter Value'][index]

    url_status = base_url + '/exports/' + current_export_id
    status = ''
    while status != 'Succeeded':
        api_call = get_request(url_status, header)
        status = api_call.json()['status']
        print(status)
        print(current_parameter_value)
		
#Save report as PDF

for index, row in df_export.iterrows():
    current_export_id = df_export['Export ID'][index]
    file_name = df_export['Parameter Value'][index]

    url_save = base_url + '/exports/' + current_export_id + '/file'
    api_call = get_request(url_save, header)

    completename = os.path.join(path, file_name + '.' + format)

    with open(completename, 'wb') as f:
        f.write(api_call.content)

Please let me know if this post was helpful and give me some feedback. Also feel free to contact me if you have any questions.

If you’re interested in the files used in this blog check out my GitHub repo https://github.com/PBI-Guy/blog

Use Dynamic M Parameters in DirectQuery mode and Paginated Reports

Recently, I got a very interesting challenge from a customer of mine. In their use case, they have created a Power BI Report (and Dataset) in DirectQuery mode. On top, they have created a Paginated Report on the same Dataset, and integrated the pixel-perfect report through the out-of-the-box Paginated Report visual. Lastly, to improve performance, they used Dynamic M Parameters in Power BI to influence the query send back to Power BI. If you’re not familiar with this approach, Microsoft has a great documentation here: https://learn.microsoft.com/en-us/power-bi/connect-data/desktop-dynamic-m-query-parameters Now, they wish to pass the selected filter from Power BI to the Paginated Report within the Visual but unfortunately it’s failing with an error message like “You have attempted to pass an invalid parameter”. Let me explore what exactly is happening and how to resolve the issue in this blog post.

Prerequisites

In this scenario we need quite a few things:

  • A database which is DQ supported. In my case I’m going to use an Azure SQL DB
  • Power BI Desktop
  • Power BI Report Builder
  • Power BI Service
  • Power BI Pro license
  • M / Power Query know how

Setting up the environment

As mentioned, I’m going to use an Azure SQL DB on which I have a an AdventureWork Database 2019. In there, I’m going to connect to the SalesLT.Product table in DirectQuery mode from Power BI.

To do so, I select the Azure SQL Database Connector, pass my Server and Database name, choose DirectQuery, and past a simple SELECT statement in the Advanced Options.

SELECT p.[ProductID]
      ,p.[Name]
      ,p.[ProductNumber]
      ,p.[Color]
      ,p.[StandardCost]
      ,p.[ListPrice]
      ,p.[Size]
      ,p.[Weight]
      ,p.[ProductCategoryID]
      ,p.[ProductModelID]
      ,p.[SellStartDate]
      ,p.[SellEndDate]

FROM [SalesLT].[Product] p

Before loading my data, I hit the transform button to switch to Power Query. In there, I want to parametrize the Server and DB name. Further, for my test purpose, I want to use the dynamic M Parameter and pass the Product Number into my M. For that reason I create three Parameters in total using the CA-1098 value as current for my product number.

Once done, I select my Sales Table and right click on the “Source” step on the right hand side. In there, I can see that Native Query is greyed out and therefore not enforced. As we need Native Query folding, we have to customize our M a little bit. If you’re not familiar with Native Query folding, I can recommend the official Microsoft Documentation found here: https://learn.microsoft.com/en-us/power-query/native-query-folding

For some data sources the View Native Query is always greyed out as Power Query can’t identify if it is enabled or not. To make sure if Native Query Folding is enabled, trace your data source and see what query has been executed on it. Additionally, you can use Value.Metadata function in M to check if “IsFolded” is set to true or not.

Now, I switch to the Advanced Editor of Power Query and customize my code to, on one hand, use the Server and DB parameters, and enforce Native Query folding on the other hand.

In the screen shot below, you can see how I use my two parameters in the Sql.Databasse function of my first Source step. Afterwards, I created a new step called Query and pasted my SQL statement in there. I want to raise your attention to the WHERE clause here in which I point to my Product Number parameter with the default value “CA-1098” right now. Lastly, I have a third step called NativeQuery in which I enforce the Native Query folding by passing the Source, Query, and enforce it by setting EnableFolding to true.

let
    Source = Sql.Database
            (
                paramServer,
                paramDB
            ),
    Query = "
            SELECT p.[ProductID]
                ,p.[Name]
                ,p.[ProductNumber]
                ,p.[Color]
                ,p.[StandardCost]
                ,p.[ListPrice]
                ,p.[Size]
                ,p.[Weight]
                ,p.[ProductCategoryID]
                ,p.[ProductModelID]
                ,p.[SellStartDate]
                ,p.[SellEndDate]

            FROM [SalesLT].[Product] p

            WHERE p.[ProductNumber] = '" & paramProductNumber & "'",
    NativeQuery = Value.NativeQuery
                    (
                        Source, 
                        Query, 
                        null, 
                        [EnableFolding = true]
                    )
in
    NativeQuery

Now, my table shows only one row for the CA-1098 Product Number an Native Query is enabled.

Before we close Power Query, I need an additional table to list all my Product Numbers. For that, I just duplicate the SalesLT Product table, rename it to Product Number, and adjust the SQL Statement to a SELECT DISTINCT.

let
    Source = Sql.Database
            (
                paramServer,
                paramDB
            ),
    Query = "
            SELECT DISTINCT p.[ProductNumber]

            FROM [SalesLT].[Product] p",
    NativeQuery = Value.NativeQuery
                    (
                        Source, 
                        Query, 
                        null, 
                        [EnableFolding = true]
                    )
in
    NativeQuery

Now I can hit the Close & Apply button. Once loaded, I switch to the Model view, select the ProductNumber column from the Product Number table, enhance the advanced options, and choose to bind this field to the paramProductNumber parameter. Pay attention that the two tables are not connected via a relationship in my model.

I hit continue on the potential security risk message that pops up next. Let’s test if it works by switching the view to Report View, add a slicer visual with the ProductNumber field from the Product Number table, and add a table visual with some columns from the SalesLT Product. After selecting a Product Number in our Slicer, we see the corresponding item in our table – it works!

Next, I publish the Report and create a Paginated Report on top of the newly created Dataset. The report itself is pretty simple, including just one Table with four columns. The Data Source is my freshly created Power BI Dataset.

I created the Paginated Report Dataset through the Query Designer in following way and selected the Parameter Checkbox for ProductNumber.

Once the Dataset and Parameter have been created, I open the properties of the Parameter. In there, I make sure I don’t provide any default value as it’s not needed. Further, I make allow Multiple Values making sure I don’t have to change it later on as I wish to pass multiple Product Numbers in a later stage.

Now, when I run the Report and select CA-1098 it works and renders my table. But there is one big but right now. I only see one value in my drop down list.

The reason might not seen obvious at the first sight but it’s very reasonable at the end. Because I provided a default value in my Power BI Dataset it filters automatically down to just this one value. Paginated Report on the other hand only can render what the PBI Datasets provide, therefore I have to make sure to load everything somehow in Power BI Dataset while the filter / parameter still have to work. Nevertheless, let’s test the Paginated Report in Power BI through the out of the box visual to see what will happen. To do so, I publish the Paginated Report to Power BI Service, switch back to Power BI Desktop and add the Paginated Report Visual into it. I add the ProductNumber field to the visual, hit Connect to Report, select my newly published Paginated Report, and hit Set Parameter. In there, I configure the Power BI field to map to my Parameter and hit See Report.

As expected, I get an error. The reason is I try to pass the “BB-7421” value to Paginated Reports, but it’s only aware of the “CA-1098” and therefore it throws an error.

Let’s fix it in my WHERE clause of the SQL Statement in which I filter down to get only one value right now. I need a way to pass “All” as default value to get all values back but once I select a value in my slicer, it should filter it down. On top, it should be multi value aware. For that, I adopt the SQL statement in SQL Server Management Studio and replace the = with “IN” and set the statement in brackets. Further, for testing purpose in SSMS, I declare a parameter and set it to “All”. Lastly, I create a CASE statement in which I check if the parameter is All and if so, then all values from ProductNumber column should be selected, otherwise only the value itself should be taken.

DECLARE @selectedProductNumber VARCHAR(50) = 'All';

SELECT p.[ProductID]
,p.[Name]
,p.[ProductNumber]
,p.[Color]
,p.[StandardCost]
,p.[ListPrice]
,p.[Size]
,p.[Weight]
,p.[ProductCategoryID]
,p.[ProductModelID]
,p.[SellStartDate]
,p.[SellEndDate]

FROM [SalesLT].[Product] p

WHERE p.ProductNumber IN (CASE WHEN @selectedProductNumber = 'All' THEN ISNULL(ProductNumber, '') ELSE @selectedProductNumber END )

After testing if the SQL statement works as expected by changing the parameter to All and different Product Numbers, I copy and paste the new SQL Statement to M in Power BI and update it to point to my parameter in Power BI. Be aware, that the DECLARE Statement is not needed here.

let
    Source = Sql.Database
            (
                paramServer,
                paramDB
            ),
    Query = "
            SELECT p.[ProductID]
                ,p.[Name]
                ,p.[ProductNumber]
                ,p.[Color]
                ,p.[StandardCost]
                ,p.[ListPrice]
                ,p.[Size]
                ,p.[Weight]
                ,p.[ProductCategoryID]
                ,p.[ProductModelID]
                ,p.[SellStartDate]
                ,p.[SellEndDate]

            FROM [SalesLT].[Product] p

            WHERE p.ProductNumber IN (CASE WHEN '" & paramProductNumber & "' = 'All' THEN ISNULL(ProductNumber, '') ELSE '" & paramProductNumber & "' END )",
    NativeQuery = Value.NativeQuery
                    (
                        Source, 
                        Query, 
                        null, 
                        [EnableFolding = true]
                    )
in
    NativeQuery

If I now change my paramProductNumber value the table reacts and if I put All into it, I see all values – perfect!

Before publishing, there is one thing left. We have to make the Parameter multi value aware so not only single values can be passed. To do that, we hit Close & Apply and switch to the model view. In there, I select the ProductNumber field and enable Multi-Select.

Now, switching back to the report view, I got another error.

The reason for this error is again the M code as the Parameter is a Text and therefore Power Query expects a text value. But passing multi values converts the parameter to a List and it can not be matched, that’s what the error says at the end. To fix it, let’s go back to Power Query and open the Advanced Editor of the SalesLT Product table. In there, I add at the top a new step which checks if the parameter is of type list, and if so, convert it to text separated by single quotes. If not, it’s just passing the same value to the selectedProductNumber step. On top, I remove the single quotes in my WHERE clause as I’m providing them in the selectedProductNumber step already and change the reference now to my newly created step.

Now, I just click Close & Apply button, delete the table visual as it’s not needed anymore, and publish my report. Don’t get confused because of the error message the Paginated Report visual is still showing – we have to first update the Dataset in the Service to see the changes.

After successfully publishing the Power BI Report, I just hit apply changes in the Paginated Report Visual and see that my selection is now passing through! Even if I select multiple values, I can see the expected result.

Please let me know if this post was helpful and give me some feedback. Also feel free to contact me if you have any questions.

If you’re interested in the files used in this blog check out my GitHub repo https://github.com/PBI-Guy/blog

Starting a job after a Power BI dataset has refreshed

This blog post is a little bit special to me as the whole idea and text is not coming from myself but from my good friends Dirk Gubbels, Principal Consultant at Microsoft, and Gabi Münster, Fabric CAT/Senior Program Manager as well at Microsoft. They approached me asking if I would be willing to share the solution on my blog and how can I say no to such a request? 🙂 Feeling even honored that they considered my blog for their idea, I’m happy to share their walk-through how to start a job after a Power BI Dataset has been refreshed.

In some business cases, there may be a requirement to perform a number of tasks as soon as a Power BI Dataset has been refreshed. This can be sending out an email, starting another Dataset process, or rendering and distributing reports. This blog post will show in detail how this can be done.

Requirements

For this to work, the following components will be created:

  • A Power BI Report with
    • A Power BI Dataset, which process will trigger the task
    • A page with a card showing data related to the last refresh time
  • A Power BI Dashboard with a time containing information on the time of the last refresh
  • A data Alert that will trigger when the Dashboard tile changes
  • A Power Automate Flow to execute the required task

Each of the components will be described in detail.

Step 1: The Dataset

Any dataset can be used for this. In this example the dataset fetches data from the public northwind OData service at https://services.odata.org/V3/Northwind/Northwind.svc/ To have a few tables and data for the report, the following model is created:

Important: To enable the rendering of the report when the Dataset is refreshed, an extra table named ‘CubeMetaData’ is created, using the following M code:

let
    Source = #table({"ProcessedDateTimeUTC", "ProcessedMinutes"}, {{DateTimeZone.FixedUtcNow(),Number.Round(Duration.TotalMinutes( Duration.From( DateTimeZone.FixedUtcNow() - DateTimeZone.From("2020-01-01 00:00:00 +00:00")))) }}),
    #"Changed Type" = Table.TransformColumnTypes(Source,{{"ProcessedMinutes", Int64.Type}, {"ProcessedDateTimeUTC", type datetimezone}})
in
    #"Changed Type"

The 2nd column is needed to set the data alert, as currently data alerts cannot be set on date or datetime values. Therefore, a column with a numeric value must be created.

Step 2: Visualizing the processed date

In the Power BI report containing the dataset, create a page with 2 card visuals, one showing the ProcessedDateTime column and one showing the ProcessedMinutes column. This can be sum or first, does not really matter as there is only 1 row anyway. Make sure the card showing the processed minutes does not use any display units. The full detail of the number needs to be visible.

The left visual will not be used, but is added for troubleshooting purposes, to see if the cube was processed.

Step 3: Save and publish the report

Save the report and publish it to a workspace on Power BI.

Step 4: Create a Dashboard

The Power Automate Flow will be triggered by a data alert in Power BI. These data alerts are only available on Dashboards. So, the next step is to create a Dashboard with a single tile referring to the refresh date/time of the cube.

Open the report that was just published:

And pin the visual showing the numeric value of the processing time to a new Dashboard:

After creating the dashboard, open it.

Step 5: Create a data alert

On the Dashboard, click the ellipsis button at the top of the newly created tile showing the processed Datetime: If the ellipsis button (…) is not visible, try changing the size of the tile.

Choose ‘manage Alerts’ to create a new data alert, and click the ‘+ Add alert rule’ button. The alert should look similar to this:

The alert condition will always be true, but because the alerts are only sent when the data changes, this effectively becomes an alert sent on data change. The data will only change when the cube processes.

Step 6: Create the Power Automate Flow

With the data alert is set up, it is now possible to start a Power Automate Flow when the alert is triggered. To do this, either click the link at the bottom of the data alert details, or navigate to https://powerautomate.microsoft.com/

Sign in and select ‘templates’ at the left side of the screen. The template ‘Trigger a Flow with a Power BI Data-driven alert’ should appear on the bottom right of the screen. If it is not visible, just search for ‘Data driven alert’.

Select the template. On the next screen, you may be asked to validate the connection to Power BI:

Validate this and click continue. The flow editor opens.

For this sample implementation, a simple mail alert step is added. The goal is to see that the Flow gets started when the cube is processed, a full implementation will depend on the business case. E.g. to export Paginated Reports in Power Automate, use the steps explained at Export paginated reports with Power Automate – Power BI or check out PBI Guy’s Blog post https://pbi-guy.com/2023/02/03/export-paginated-reports-automatically-in-a-low-code-way-without-power-bi-premium/

The flow looks like this:

Ensure the flow is saved.

Step 7: Testing the solution

To test the solution, process the Dataset. Before the Dataset can be processed, the credentials need to be set. In this case, we’re using an anonymous OData feed. Go to the settings of the Dataset and click ‘edit credentials’ on the data source credentials.

Once this is done, the dataset can be refreshed.

As the alert will be triggered maximum once per hour, it is best to schedule a few automatic refreshes with a few hours in between, and compare the refresh history with the flow execution history:

This shows there is around a 5 – 7 minute delay between the refresh finishing and the Power Automate job starting.

Alternatively, a similar result can be achieved using Scorecards and Goal instead of a Dashboard and a tile.

Add-on from PBI Guy: You could also trigger a Dataset refresh via Power Automate and use the REST API to check the status of the Dataset Refresh. Once finished, the Flow could proceed and send as well an e-mail or whatever is required. This way you would have more control over the whole process, but would require more skills to call the Power BI REST API. Lastly, you could also create more complex rules by executing DAX statement against the Dataset via the REST API or Power Automate and check tresholds in Power Automate to trigger an e-mail alert.

Limitations

Please be aware that Data Alerts currently are not triggered if you refresh the Dataset using the XMLA endpoint or the enhanced refresh API.

Conclusion

The steps above explain how to create a Power Automate Flow that is executed after a Power BI Dataset is refreshed. This opens the door for many different business scenarios of tasks that need to run as soon as new data is available in a Power BI Dataset.

Once more, thank you very much for these insights Dirk and Gabi and I hope we’ll collaborate even more in near future!

Please let me know if this post was helpful and give me some feedback. Also feel free to contact me if you have any questions.

If you’re interested in the files used in this blog check out my GitHub repo https://github.com/PBI-Guy/blog

Create a POST request with Power BI

In my last post, I showed how you can connect to a REST API with Power BI by using a Service Principal. After that, I got quite a lot of comments and questions if it would be possible to also create a POST request with Power BI, not only a GET one. First, I thought it will not be possible as Power BI is a “read-only” tool, but I love challenges so I gave it a try. After a while, I found a way how to do so which I explain in this post!

Prerequisites

I’m going to use the PBIX file I created before to connect to the Power BI REST API. But instead of listening all workspaces, I’m going to execute a DAX statement and calling the Execute Queries in Group REST API (https://learn.microsoft.com/en-us/rest/api/power-bi/datasets/execute-queries-in-group). Therefore, following things are needed

  • Power BI Desktop
  • a Service Principal
  • Sufficient permission to call the REST API
  • a published Power BI Dataset to execute a DAX statement against it

Let’s start

I’m not going to walk you through how to use a Service Principal and authenticate against the Power BI REST API with it. You can find it in my previous blog post here (https://pbi-guy.com/2023/03/25/connect-with-power-bi-to-the-power-bi-rest-api-with-a-service-principal/). To easy things up, I’m going to use the PBIT file from the last post, which you can find in my GitHub here.

Once opened, I enter the required parameters as seen below and hit Load.

After the data loaded successfully, I enter Power Query Editor by hitting the Transform data button in the ribbon. Once here, I select New Source – Blank Query.

As we have to do some M-Language on our own, we can’t use the Web Connector to create a POST request. Therefore I start with a blank query. Once loaded, I select Query1 and hit Advanced Editor to open the M-Language Editor.

I’ll now create step by step my URL with the request body and will combine afterwards everything into one step. So let’s start with the URL. According to the documentation, the URL to execute a DAX statement looks as following:

POST https://api.powerbi.com/v1.0/myorg/groups/{groupId}/datasets/{datasetId}/executeQueries

This means we need a Workspace (group) ID as well as a Dataset ID. Heading over to powerbi.com, I’m selecting a Dataset on which I wish to execute my DAX statement. Now, I can find the needed details in the URL.

Copy and pasting the ID into my Power BI M-Language, I got now following line.

Because I want to parametrize my URL as well as my DAX statement, I press Done, select Home Ribbon – Manage Parameters, and create three new text parameters called paramWorkspaceID, paramDatasetID, and paramDAX. The last one is for my DAX statement, which I also wish to parametrize. For my DAX parameter, I use a simple code to evaluate the Top 10 Cities from my Dataset. Important to note, I need the quotation at the beginning and at the end of my DAX statement.

Now let’s go back to my Query1, hit Home Ribbon – Advanced Editor. After the window for M-Language pops-up, I replace the hardcoded Workspace and Dataset ID to replace it with my new parameters. To do so, I add a quotation in front and at the end of the ID, add a & at the same position, and replace the id with the corresponding parameter.

Next, let’s create the required body. I add a coma at the end of my URL step, call my next step Body, and copy & paste the body from the doc between two quotations. To make it a little bit more readable, I format the body as seen below. Important, I have to reference my new step at the end after “in”.

As the body includes quotations, we have to make sure they will be recognized. Therefore, I format the body and add another quotation to each already existing one. Further, I remove the serializerSettings and the impersonatedUserName as those attributes are not needed in my case. Lastly, I included my DAX parameter after the query attribute. Now, my M-Code looks like following and the Token warning message at the bottom is also gone.

As a next step, I have to make sure the body is recognized as JSON format. All I need to do is to add another step, naming it (Parsed_JSON in my case), and use the function Json.Document(Body). At the end I also need to reference to my last created step in the in clause. This step is not really required for the whole purpose, it’s just making sure the body is a valid JSON format.

Making sure everything works as expected, let’s hit Done and check all steps. If I select the URL step now, I should see just a URL including Workspace and Dataset ID we’re going to call. Looks good so far.

If I check the Body step, a JSON format-like body should be visible. If I compare it with the documentation, it should be more or less the same without any additional quotations or anything else, including my DAX statement coming from my parameter. Looks also good.

In my last step, Parsed_JSON, I should see a Record “List” which I can transform to a table. This indicates that the conversion to JSON has been successful and that we don’t have a typo in our Body step.

Now, we’re ready to call the URL. I create a new step called “Source” and use the Web.Content Connector (which is the Web Connector). In there, I provide first the URL I wish to call which is coming from my URL step. Next, I have to specify the Header information. To do so, I open square brackets and add Headers=[]. In the second square brackets, I have to add the Authorization and the Content-Type. The Authorization is coming from our previously created function (see my last blog post) and the Content-Type is “application/json”. After closing the second square brackets, I have to provide the body to execute our DAX statement. I’ll do this with “Content = Text.ToBinary(Body) referencing to my Body step. At the end, I have again to reference to my last step “Source” in M.

After hitting done, I should be able to get a result now.

If you see “Expression.Error: Access to the resource is forbidden.” try to refresh the table to execute the fnGetToken function to get a new token. If it still doesn’t work, make sure your service principal has sufficient permission to the Dataset.

I now hit the “Into Table” button in the Convert Ribbon. Afterwards, I select the two arrows and hit Expand to New Rows.

As a next step, I almost do the same like before by selecting the two arrows, deselect “Use original column name as prefix” as I don’t need that, and hit ok.

Those steps have to be repeated three more times until you get following screen.

Now, we just have to expand it one more time to get our final result!

At the end, I wish to give a proper name to my Table (renaming from Query1 to POST Request Execute DAX), specify data types for each column and remove / transform as I wish. My final result looks like following.

And the M-Code behind can be seen below.

let
    URL = "https://api.powerbi.com/v1.0/myorg/groups/" & paramWorkspaceID & "/datasets/" & paramDatasetID & "/executeQueries",
    Body = "
        {
            ""queries"": 
            [
                {
                ""query"": "& paramDAX &"
                }
            ]            
        }",
    Parsed_JSON = Json.Document(Body),
    Source = Json.Document(
        Web.Contents(
            URL, 
            [
                Headers= [
                    Authorization=fnGetToken(), 
                    #"Content-Type"="application/json"
                    ],
                Content = Text.ToBinary(Body)
            ]
        )
    ),
    Results = Source[results],
    #"Converted to Table" = Table.FromList(Results, Splitter.SplitByNothing(), null, null, ExtraValues.Error),
    #"Expanded Results" = Table.ExpandRecordColumn(#"Converted to Table", "Column1", {"tables"}, {"tables"}),
    #"Expanded Tables" = Table.ExpandListColumn(#"Expanded Results", "tables"),
    #"Expanded Record" = Table.ExpandRecordColumn(#"Expanded Tables", "tables", {"rows"}, {"rows"}),
    #"Expanded List" = Table.ExpandListColumn(#"Expanded Record", "rows"),
    #"Expanded All Records" = Table.ExpandRecordColumn(#"Expanded List", "rows", {"dimCity[City Key]", "dimCity[City]", "dimCity[State Province]", "dimCity[Sales Territory]"}, {"dimCity[City Key]", "dimCity[City]", "dimCity[State Province]", "dimCity[Sales Territory]"}),
    #"Changed Type" = Table.TransformColumnTypes(#"Expanded All Records",{{"dimCity[City Key]", Int64.Type}, {"dimCity[City]", type text}, {"dimCity[State Province]", type text}, {"dimCity[Sales Territory]", type text}})
in
    #"Changed Type"

I also created a PBIT file which can be found in my GitHub repo.

This way we created a POST Request to a REST API and got a result back with Power BI – awesome! Nevertheless, I still wouldn’t recommend to go this way as the Client Secret as well the Client ID has to be exposed in a parameter which is definitely not secure. I haven’t crossed an alternative so far to securely store a password in Power BI except of building an own connector.

Please let me know if this post was helpful and give me some feedback. Also feel free to contact me if you have any questions.

If you’re interested in the files used in this blog check out my GitHub repo https://github.com/PBI-Guy/blog

Power BI Object-Level-Security

Many users are aware that Power BI offers Row-Level-Security to secure their data. As example you can use RLS so users from a specific country can only see the sales numbers from this country and not others. I did already a blog post about the different possibilities (see https://pbi-guy.com/2021/10/12/power-bi-row-level-security/ & https://pbi-guy.com/2021/10/15/power-bi-row-level-security-organizational-hierarchy/ & https://pbi-guy.com/2021/10/15/power-bi-rls-configuration-in-service/). But many customers don’t only want to secure on a row-base they also want to secure their data on a “column-” or “table-base”. And exactly for this purpose Power BI offers Object-Level-Security. Let me walk you through how to set up OLS in Power BI.

Prerequisites

  • Power BI Desktop
  • Power BI Service Account
  • Tabular Editor

How to

To enable OLS we start in Power BI and create first a data model. I’m going to use my standard Sales Report with Wide World Importers sample data. Further I created three visuals with Text boxes to show the different OLS options – No OLS applied, only on one specific column (customer), and on the whole table (dimEmployee). Every visual shows the Profit by different dimension. First one by Sales Territory, second one by Buying Group, and the third one by Employee.

As a next step we have to create the different Roles so OLS can be applied to it. Go to the Modeling Tab in the Ribbon and select Manage Roles.

In here I created two different roles – one where only the OLS for the column Customer should be applied and one where the whole Table dimEmployee should be secured. No DAX expression or anything else is needed – just the two empty roles. Once done hit the Save button.

After the test page and the roles are set up I connect to my model with Tabular Editor by selecting it through the ribbon External Tools.

Pro Tip: If you open Tabular Editor directly from Power BI Desktop you’ll be automatically connected to your data model.

Once Tabular Editor has opened you should see a similar screen like the below.

As a next step I expand the Roles and select first the “OLS on Table dimEmployee”. Once the role is selected in the property pane you see a property “Table Permissions” in the “Security” section. Expand it and configure “None” to the table which should be secured. In our case it’s dimEmployee. This means that every user who will be added to the “OLS on Table dimEmployee” role afterwards will not see any data coming from the dimEmployee table.

Now I select the other role and instead of “None” I set the dimCustomer Table to “Read”. The reason is we just want to secure one specific column and not the whole table. Therefore the table can be read in general but we have to configure specific columns which should be secured. After you set the dimCustomer table to read the role can be expanded on the left hand side which lists all tables in “Read” or “None” mode.

Next select the dimTable below the role, head over to “OLS Column Permissions” under “Security” in the property pane and set the column “Customer” to “None”. Every other column will use the Default behavior of the table which is “Read”.

After we set up everything now in Tabular Editor we can save our model and close Tabular Editor. Back in Power BI Desktop let’s test our roles. First I test the “OLS on Table dimEmployee” role by going to Modeling – View as – selecting OLS on Table dimEmployee – and hit OK.

We see that our OLS works because the right hand visual is not showing anything. Further the whole table dimCustomer is also not visible.

That’s exactly what we expected – great! Let’s test the second role. After we switched the view every visual is showing up but the “Customer” field in the table “dimCustomer” is hidden. This is also expected as we’re not using the Customer field in our report so far therefore everything can be shown.

Let’s turn of the role view and replace the “Buying Group” column with “Customer”.

Than we enable the role view again to see if security applies.

And as we can see yes it does! Because the visual is using the column Customer now it’s not showing up.

As a last step you would need to publish the report to the Service and assign user / groups to the desired role. One user / group can also be added to multiple roles if needed like with RLS.

Personally, I find the OLS very useful to secure your data model but the message which appears to end user is not very user friendly. I would love to see an update here which says at least it’s secured instead of “Something went wrong” because as an admin it’s expected behavior and not wrong. Best option would be if I could configure the message as I wish.

Please let me know if this post was helpful and give me some feedback. Also feel free to contact me if you have any questions.

If you’re interested in the files used in this blog check out my GitHub repo https://github.com/PBI-Guy/blog

Show “secured” Images in Power BI

Use Case

From time to time I got asked how you can display images in Power BI. The answer is pretty simple and straight forward (see https://docs.microsoft.com/en-us/power-bi/create-reports/power-bi-images-tables) if the image is publicly available. But customers can’t expose their internal pictures to the public and still want to display them in Power BI. The issue is with “secured” images that the Power BI visual can’t log in with an account to be able to display it. So how can you still save your images in a secured environment and still display them in Power BI? Let’s check it out.

I tried different ways and found two that work. One would be to get the binaries of each image, transform it to a text field and display afterwards with a custom visual the image. This solution has a big “but” from my point of view. Because the text field has a 32766 character limit you would either have to resize your image or you have to do some Power Query and DAX magic to split the field into multiple ones and add them afterwards together again. Chris Webb wrote a blog how this could be done here: https://blog.crossjoin.co.uk/2019/05/19/storing-large-images-in-power-bi-datasets/

As good as this solution might be I would like to find an easy, low-code / no-code way to achieve the same. And luckily there is one!

Power Apps & Power BI – Better Together

Because Power BI is part of the Power Platform and Microsoft offers a seamless integration into the other Services (and vice versa) let’s leverage the benefits of it and try to display our images through a Power Apps app in Power BI.

Prerequisites

To be able to implement the solution you would need a few things:

  • Power BI Desktop
  • Power BI Service Account (optionally)
  • Power Apps Account
  • SharePoint Document Library with pictures

The Power BI Desktop can be downloaded for free through the Power BI website. Power Apps is included in different licensing options like E3 or E5. In our case we’re going to use a SharePoint Connector which is a Standard Power Apps connector meaning no additional licensing is needed. If you don’t have a Power Apps license yet you can sign up for a Developer Plan and use to for development purpose. Keep in mind that you can’t share your apps created with a Dev. Plan nor can you show Power Apps apps in Power BI coming from this specific environment.

How to

We start in Power BI Desktop and connect to our SharePoint list to get a few basic details. I’ll not guide you through how to connect to a SharePoint Document Library. These details can be found here. In my case I have a simple Document Library with some Star Wars picture.

In Power BI I connect to the Document Library and get only the ID, Notes, Created, Modified, and ServerRelativeURL fields. You can of course select more or less fields but make sure you get the ID which will be needed later on in the Power Apps app.

Once loaded I create a simple Table visual with the three fields ID, Notes, and ServerRelativeURL to display some data. As a next step I add the Power Apps Visual to my canvas and position it to the right. Once you added the Power Apps Visual you’ll see the necessary steps how to get started.

So let’s do our first step and add our wished fields to the data section of the visual. This fields can be accessed later on through Power Apps. Make sure to add the Id field and also check that it doesn’t summarize! The behavior (Sum, Count, etc.) will be provided to Power Apps and we don’t want to summarize our Ids. As soon as you add your first field the Power Apps visual will change where you can choose and existing app or create a new one. In our case we’re going to create a new one. A window will pop up asking if it’s ok to open your browser with the Power Apps URL. Hit OK.

Tip: If you’re facing some issues while opening Power Apps or you can’t choose your environment through the Visual, open Power Apps in your default browser, choose your environment in the browser, switch back to Power BI and try to hit the “Create New” button again.

Once Power Apps is loaded you’ll see an object call “PowerBIIntegration” (besides some others). This object has been automatically created through Power BI and makes sure that Power BI and Power Apps can interact with each other. This means for example if you select now a specific image to filter the same filter will also apply in Power Apps. That’s the reason why you have to start from Power BI and create an App from there. Otherwise the “PowerBIIntegration” object will not be created.

Let’s quickly test if the integration really works. I select the Baby Yoda picture in Power BI and the list is automatically filtered in Power Apps – great!

Our next goal is now to show the Images from SharePoint in our Power Apps app and make sure the integration still works (filter on a specific image in Power BI should also filter the Image in our app). Therefore we first have to create a connection to our SharePoint list. To do so go to the Data Tab in Power Apps and add SharePoint as data source.

If you haven’t created a connection yet hit the “Add a connection” button. In my case I can choose an existing one.

Afterwards choose your Site and Document Library in which you stored your pictures. In my case I have a Doc Library called PBI Guy Pictures. I select it and hit “Connect”.

Now that we’re connected to our Doc Library we can display the images out of it. To do so insert a Gallery. I choose a vertical one but the layout can be modified afterwards as well.

Once inserted I adjust the two Galleries so that our freshly inserted one is at the top and at the bottom I display the first Gallery. Per default our new Gallery shows default text and images. We have to connect our Gallery to our SharePoint Doc Library and than decide what we wish to display. So let’s connect it by selecting the Gallery and set the Data source through the Properties pane.

Our next step is to display the right image. Select the first image object in the Gallery and choose the “Items” property either on top left of the screen or find it in the properties pane in the Advanced section.

Replace “SampleImage” with ThisItem.’Link to item’ to create the link to our needed image.

You can also modify the view of the Gallery, add new fields into it, etc. but in my case I just want to display my notes with the ID together. Therefore I select the ID Text Box and change the code in the function window from ThisItem.ID to ThisItem.ID & ” ” & ThisItem.Notes

Our last step is to create a connection between our SharePoint Gallery and the “Power BI Gallery” from the beginning so that filters from Power BI will effect our SharePoint Gallery as well. The best way to do so is to filter the new Gallery by an ID to make sure we got that one specific image we’re looking for. That’s the reason why we need our ID field from the beginning! 🙂

To filter the new Gallery select it and choose the Items property. In my case I see ‘PBI Guy Pictures’. This is the whole table we have to filter and making sure that only the selected ID is showing up. Therefore we wrap our Table with a Filter() statement. Our first argument in the filter statement is the ‘PBI Guy Pictures’ table. Our second argument is the filter condition which should point the ID field from Power BI to the ID field of SharePoint. Therefore we use the PowerBIIntegration object to grab the necessary data. Unfortunately this is a Table Data Type and we can’t match Table with a single Number Data Type. To get a single value I extract just the first value of the whole table with the First() statement followed with the column I’m looking for (ID in this case). Our whole function looks now as following: Filter(‘PBI Guy Pictures’, First([@PowerBIIntegration].Data).Id = ID) And I immediately see that it works! Previously I selected Baby Yoda and now only this picture is showing up.

As a last step I want to make sure the first Gallery is not visible in my app. So I select the first Gallery and set the Visible property to false.

Of course you can now modify your app and make it more shiny but just for the demo purpose I save it as it is now through File, Save. Once done the App is ready to be used in Power BI as well and the cross-filter works!

If you wish to share the report make sure all users have also access to the Power Apps app and the SharePoint Library. Otherwise people won’t be able to see the pictures in their report.

Please let me know if this post was helpful and give me some feedback. Also feel free to contact me if you have any questions.

If you’re interested in the files used in this blog check out my GitHub repo https://github.com/PBI-Guy/blog

Power BI Licensing

One of the most discussed topics with my customers and partners is Power BI licensing. Typical questions are

  • I want to create a report for my own use do I need a Power BI Pro license?
  • Does a report viewer also need a Power BI Pro license?
  • What if we have like 1000 Users does everybody need a Pro license?
  • What are the costs?

In this post I try to explain the different licensing options for Power BI. Further I’ll discuss some various scenarios and what kind of license would fit best.

First things first. We need to understand what kind of products Power BI has in his portfolio.

Power BI Products

Power BI Desktop

The Power BI Desktop is a client application in which you can author modern and interactive reports. You can save those files as a PBIX format. I’ll highly recommend to install and use it as you have the full flexibility to create your report and data model, and modify it as needed. For more information please visit https://powerbi.microsoft.com/en-us/desktop

Power BI Service

The Power BI Service is a cloud-based modern business analytics solution in which you can publish (PBIX files) or even create reports. Creating reports in the service is – as of today – limited comparing it to Power BI Desktop. For example you can’t use DAX to enhance your model in the browser. You can find more information on https://docs.microsoft.com/en-us/power-bi/service-get-started

Power BI Premium

Power BI Premium is a dedicated capacity for your organization. It has the same functionality as the Power BI Service but it gives you more consistent performance, larger data volumes, and the flexibility you need. See also https://powerbi.microsoft.com/en-us/power-bi-premium

Power BI Report Server

Instead of going to the cloud Power BI offers a on-premises Report Server on which you can publish and distribute your Power BI reports in-house. It does not have all services & features like the Power BI Service – like the natural Q&A – but most of it. Further information can be found here https://powerbi.microsoft.com/en-us/report-server

Power BI Embedded

If you would like to embed Power BI Reports in your own application then Power BI Embedded is the right choice. It’s designed for Independent Software Vendors (ISVs) and developers. More information can be found here https://powerbi.microsoft.com/en-us/power-bi-embedded

Power BI Mobile

Power BI Mobile offers you to connect to your data and see your reports on the go for any device. You can download the app from Microsoft, on the App Store, or Google Play. For more information please visit https://powerbi.microsoft.com/en-us/mobile

After we have clarified what kind of products are available let’s deep-dive into the different licensing options.

Power BI Licenses

Power BI Free

Power BI Desktop and Power BI Mobile are free for all users! Regardless of what other product (Power BI Service, Power BI Report Server, etc.) you are using those two are totally free. Further there is a limited Power BI Service free edition in which you can use following features: All Connectors, Publish to Web, and Export to PowerPoint, Excel, CSV. This means if I would like to create a report for myself I can download the Power BI Desktop, create a report, publish it to Power BI Service and use e.g. a Dashboard to combine different Reports. Further I can connect with my mobile device to Power BI Service and see my dashboard on the go. Awesome! The Power BI Free license is still required so an user can log in into the service. With the Power BI Free license Microsoft makes sure that the org admin has allowed access to Power BI Service in general for the specific user.

Power BI Pro

As mentioned Power BI Desktop and Power BI Mobile are free for all users but the Power BI Service free edition does not have all features covered. One of the most asked one is the “Peer-to-peer sharing” feature which allows me to share my Dashboards, Reports, and Datasets with other users. To be able to do so I, the author, have to have a Power BI Pro license regardless if my organization uses Power BI Service, Power BI Premium, Power BI Embedded, or Power BI Report Server. For the viewer of the report it depends what the company has decided to use. If Power BI Service is the chosen one then the viewer has to have a Power BI Pro License as well. If Power BI Premium or Power BI Report Server is in use than a consumer needs a Power BI Free License. Even if the License itself is free an administrator has to assign it to the user. For more information and a comparison between Free and Pro please visit https://docs.microsoft.com/en-us/power-bi/service-free-vs-pro

Power BI Premium

Power BI Premium is a capacity pricing variant. There are different sizes (cores) available. The Whitepaper can be downloaded here. Capacity pricing means that not all users need a License. Only the author has to have a Power BI Pro License. All viewers / consumers do not need a Pro License but the admin has still to assign a Free License to all needed users.

Power BI Premium per User

Power BI Premium Per User allows organizations to license Premium features on a per-user basis. Premium Per User (PPU) includes all Power BI Pro license capabilities, and also adds features such as paginated reports, AI, and other capabilities that are only available to Premium subscribers. More information can be found here: https://docs.microsoft.com/en-us/power-bi/admin/service-premium-per-user-faq

Power BI Report Server

An organization can purchase Power BI Report Server in two different ways: By using Power BI Premium you are also allowed to use Power BI Report Server or you have a SQL Server Enterprise Edition incl. Software Assurance. In both cases an author still needs a Power BI Pro License to share Power BI Reports. Viewers don’t need a license at all.

Power BI Embedded

With Power BI Embedded you are allowed to embed Power BI Reports into your own application. Depending on which License type (A, EM or P SKU) you are using viewers need a Power BI Free License assigned (EM or P SKU) or you have to manage authentication within your application (A SKU). In both cases an author still needs a Power BI Pro License to share reports. For more information please visit https://docs.microsoft.com/en-us/power-bi/developer/embedded-faq

Phu! That has been a lof of information! Let’s discuss now some various scenarios and see which Product would fit best and which License is needed.

Scenarios

Luke testing for himself

Let’s imagine Luke would like to build some Reports for himself. He would like to connect to different data sources like Excel, CSV, SQL Database and Google Analytics. Further he would like to build a Dashboard and connect to it with his tablet and mobile device.

In this case he will use Power BI Desktop to create and publish reports, Power BI Service to build Dashboards and Power BI Mobile to connect with his mobile device or tablet to his Dashboards. Everything is possible with the Power BI Free License.

Obi-Wan would like to see Luke’s Dashboard

Luke is so excited about Power BI and his Dashboard he would like to show it to Obi-Wan. Obi-Wan shouldn’t be able to change anything in the report therefore Luke wants to share it within the Power BI Service with him.

Luke and Obi-Wan will both use the Power BI Service and both need a Power BI Pro License to share and view the Dashboard.

Luke would like to leverage some Premium features and share it with Obi-Wan

Luke would like to enhance his report with some out-of-the-box AI capabilities that Power BI Premium offers. But just for the two of them it doesn’t make sense to purchase Power BI Premium. Therefore Luke decided to leverage the Power BI Premium per User license to get the Premium features like AI, paginated reports, and other capabilities.

Because Luke would like to leverage Premium features he need a Power BI Premium per User (PPU) license. Because he wishes to share it with Obi-Wan, he also needs a PPU license due to the fact that Premium features are used and a Pro license is not sufficient. The matrix below will clarify which license type can view / access what kind of content.

Chart of which users can see content based on license types

The Rebels are interested in Luke’s Dashboard

Luke and Obi-Wan are both so excited about the possibilities of Power BI that they are telling everybody about it. Therefore the interest is growing and nearly every Rebel would like to see Luke’s Dashboard. Because of the growing interest, the huge number of viewers, and the more and more complex Dashboards Luke thinks a dedicated capacity would make sense.

In this scenario Luke would go for Power BI Premium. This means he has to republish his report from Power BI Desktop to the Premium capacity (or assign the existing workspace to a Premium node) and make it available for all Rebels incl. Obi-Wan. Because the Rebels are now using a Premium capacity non viewer needs a Power BI Pro License but Luke has still to assign a Free License to each user. Instead of doing it for each user separately he decides that every user can sign up individually for Power BI (Settings in Power BI admin portal). This reduces the burden for Luke.

The Senators pass a new galaxy data protection regulation (GDPR)

The Galactic Senators pass a new law which strictly forbid to use and show personal data without the approval of the person itself. Luke doesn’t want to take any risks and decides to go on-premises instead of the cloud until the Rebels clarify if they are allowed to use all personal data.

Luke installs a Power BI Report Server on which he publish his Report from Power BI Desktop. Further he added all users to the Report Server, shares his Report, and deletes the Dashboard, Report and Datasets in Power BI Service and Power BI Premium to make sure everything is by law. In this case Luke needs a Power BI Pro License to share his report while all other users as viewers need only a Power BI Free License. Further because they already purchased Power BI Premium the Rebels are allowed to use the Power BI Report Server as well.

R2D2 should show Power BI Dashboards

Luke would like to enable R2D2 to show his Dashboard. To do so he goes for Power BI Embedded.

Because Luke would like to show his Dashboard on his own application (or android 🙂 ) he needs to have Power BI Embedded. Further he doesn’t need any Power BI Service graphic user interface (GUI) therefore the A SKU is enough. But Luke still needs a Power BI Pro License to be able to share his Dashboard with others while all viewers do not need any License at all this time.

Now that we clarified what kind of products and Service Power BI offers as well as how to license them properly let’s have a look at the cost. I’ll use list prices publicly available from the Power BI website. Keep in mind that the prices can change.

Power BI License Cost

Power BI Desktop

As mentioned during the post Power BI Desktop is absolutely free and can be used without any cost.

Power BI Mobile

The Power BI App for your mobile device is also free.

Power BI Free License

The Power BI Free license is, as the name says, as well free and has no costs.

Power BI Pro License

The Power BI Pro License costs $9.99/User/Month. This means if you have for example five users and everyone will require a Pro license your monthly cost will be $49.95$ for the five users.

The Pro license can be purchased as stand alone or through E5 as Power BI Pro is included in E5.

Power BI Premium per User

The PPU License costs $20/User/Month. If you already have a Pro License you just need the add-on which is $10/User/Month. Imagine having seven users with a Pro License and ten users with a Free License and all of them require now a PPU. In this case you would need to purchase the add-on for seven users (7x$10) and ten PPU stand alone Licenses (10x$20) which means you’ll have a total cost of $339.93 (7x$9.99 Pro License + 7x$10 Add-on + 10x$20)

Power BI Premium

If you’re interested in Power BI Premium the smallest SKU (P1 with 8 v-cores) costs $4’995.- per month. From a purely cost perspective this makes sense if you have 500 or more users. This 500 users break-even-point can be easily calculated by dividing the Premium costs by the Pro License costs: 4995 / 9.99 = 500. Keep in mind that there are more reasons to go for Premium than just cost!

Imagine if you have to share a report with 600 users. In such a scenario every user would require a Pro License if you share it through Power BI Service. Therefore the total cost for these 600 users would be $5’994.- per month (600x$9.99). As we see it would make more sense to purchase Power BI Premium and assign a Pro License just to the developers of the report (let’s say 10 developers). In this case the total cost would be $5’094.90 (10x$9.99 + $4’995) and we saved roughly $900 per month!

Power BI Report Server

Power BI Report Server is included in Power BI Premium or through SQL Server Enterprise Edition with SA. In the first case, included in Premium, the minimal cost is therefore $4’995.- per month (P1 SKU with 8 v-cores). Just to point out that if you purchase Power BI Premium P1 you can use Premium and install a Power BI Report Server on top of it 8 cores in-house and use in total 16 cores!

If you’re interested in SQL Server Enterprise Edition with SA best would be to contact your Microsoft representative.

Power BI Embedded

Power BI Embedded is a Microsoft Azure Service and will charge you as long as it runs. Once you stop the Service there are no costs at all. The smallest SKU A1 is roughly $740 per month if it runs 24/7. A detailed price list can be found at https://azure.microsoft.com/en-us/pricing/details/power-bi-embedded/

Conclusion

I think the most important information is regardless of which product you are using (Power BI Service, Premium, Report Server or Embedded) as soon as you would like to share a Report you will need a Power BI Pro License. For the viewer it depends on which product the report is published. In Power BI Service a viewer also needs a Power BI Pro License, in Premium and Report Server a Free License is enough. For an embedded scenario a Free (A SKU) or non License (EM or P SKU) is required. Lastly, if Power BI Premium per User license is used by the author all viewers will also require the PPU license.

To get a better overview of the estimated cost I created a Power BI Report which you can use to calculate your cost based on the number of Power BI Developers and Viewers. Keep in mind Power BI Premium offers more features and could be useful not only to save cost! Check it out here.

Please let me know if this post was helpful and give me some feedback. Also feel free to contact me if you have any questions.

If you’re interested in the files used in this blog check out my GitHub repo https://github.com/PBI-Guy/blog

Power BI RLS configuration in Service

In my last two posts (see here and here) I wrote about Row-Level-Security (RLS) and how to configure it in Power BI Desktop. This time I would like to show how easy it is to publish a report to the Power BI Service and use the defined roles for specific users or security groups.

In this post I am going to use my last Power BI file with the RLS organizational hierarchy. As you guessed it right I am a big Star Wars fan and will use those characters for my demo. The picture below shows the current hierarchy.

Of course this hierarchy is not representative for the characters strenghts, popularity or similar. 🙂

The Power BI Report itself didn’t change a lot. Let’s imagine Obi-Wan is the author and creates a report with a table including all employees (Name and ID) and their salary, a card with the salary information and the current user ID. By pressing the Publish button in the Home Ribbon he can publish the report directly to his workspace in Power BI.

In this case Obi-Wan would like to publish it to the “PBI Guy” workspace. The publishing process will take a few seconds. Afterwards a success message will appear similar to the one below. With a click on the hyperlink the Power BI Report automatically opens in Power BI Services.

Once Power BI Services has loaded in Obi-Wan’s default browser he can extend the PBI Guy Workspace, hit the three dots of the Dataset and choose Security.

Now all in Power BI Desktop created roles are available and Obi-Wan can add users our groups to it. Because he created just one (Hierarchy) only one is available. Thanks to Azure Active Directory (AAD) suggestions are made while typing. For now he adds Luke and Yoda to the Hierarchy role. You can also add Security, Distribution, and Mail-enabled Groups. Once members are added they will be listed below.

Keep in mind that RLS works only for Viewers and users who has build permission on the dataset. Admin, Member, and Contributor of a workspace are not affected from RLS!

After saving one final step is required – test if RLS works as expected. To do so hit the three dots of her Hierarchy role and choose Test as role.

Choose the little arrow at the top and select on which behalf you would like to test the report. In my case I choose Luke and hit Apply afterwards. I do not select the Hierarchy role as it would test it than on my current logged in user.

As we can see RLS works perfectly fine!

One last test as Yoda confirms that RLS is working.

Now I can share the report with all users and only those who has the right permission will see what they are allowed to see – fantastic!

Please let me know if this post was helpful and give me some feedback. Also feel free to contact me if you have any questions.

If you’re interested in the PBIX and Excel file used in this blog post check out my GitHub repo https://github.com/PBI-Guy/blog