From time to time I got asked how Fabric admins can automatically get notified if a new Tenant Setting appear as they don’t wish to manually check the UI on a regular base. Even with the new “New” indicator, it’s still a manual process. Luckily, back in May 2023, we introduced a GetTenantSettings API which we can leverage to create an automated notification process! In this blog post I’ll show you how to leverage the different Microsoft Fabric components to get a Teams notification once a new Setting is available.
Prerequisites
Following things are needed for this solution:
- Microsoft Fabric Capacity (F2 or above, or a Trial license)
- Service Principal with sufficient permission
- Python skills
- basic knowledge of REST API calls
Let’s get started
In my case, I created a simple F2 capacity in the Azure Portal (see https://learn.microsoft.com/en-us/fabric/enterprise/buy-subscription#buy-an-azure-sku) and assigned my PBI Guy Premium Workspace to it. In there, I created a new Lakehouse called PBI_Guy_Lakehouse. Once created, I create a new Notebook to get started with my Python code. Before I begin, I rename it to “Get Tenant Settings”.
As usual, in my first cell I import all required libraries.
#Import necessary libraries

import msal
import requests
import json
from datetime import datetime
from pyspark.sql.functions import col, explode_outer
Next, I need to get an access token to authenticate against Fabric. I showed in my previous blog posts (e.g. https://pbi-guy.com/2023/11/17/export-power-bi-reports-as-pdf-via-rest-api/) how to do so. In this specific case, I create a separate Notebook to leverage the code for future development and call it “Get Fabric Access Token”. As I stored the secret in Azure Key vault, I use following code to get it.
#Define paramter
key_vault_uri = ''
client_id = ''
authority_url = "https://login.microsoftonline.com/..." #replace three dots with your organization
scope = ["https://analysis.windows.net/powerbi/api/.default"]
#Get Secret from Azure Key Vault
client_secret = mssparkutils.credentials.getSecret(key_vault_uri,client_id) #Use MSAL to grab token
app = msal.ConfidentialClientApplication(client_id, authority=authority_url, client_credential=client_secret)
token = app.acquire_token_for_client(scopes=scope)
#Create header with token
if 'access_token' in token:
access_token = token['access_token']
header = {'Content-Type':'application/json', 'Authorization':f'Bearer {access_token}'}Back to my “Get Tenant Settings” Notebook, I add following code as my second cell.
%run Get Fabric Access TokenNext, I specify my parameters I wish to reuse.
#Set Tenant API URL
url = 'https://api.fabric.microsoft.com/v1/admin/tenantsettings'

#Get Current datetime
now = datetime.now()
I got used to create functions for calling APIs. Looks like an overhead right now as we’re just calling the API once, but always good to be ready for future improvements. Therefore, I add following cell.
#Define Request Functions
#Get Request
def get_request(url, header):
    api_call = requests.get(url=url, headers=header)
    return api_call

#Post Reuqest
def post_request(url, header, body):
    api_call = requests.post(url=url, headers=header, json=body)
    return api_call
Each function expects a URL and a header. The Post request also requires a body. Now that I defined all parameters and successfully got a token to authenticate, I can call the GetTenantSettings API. Afer retrieving the result, I convert it to a PySpark DataFrame and show the result.
#Call API
api_call = get_request(url, header)

#Convert result to JSON and store in a dataframe
result_tenant_settings = api_call.json()['tenantSettings']
df_tenant_settings = spark.createDataFrame(result_tenant_settings)

display(df_tenant_settings)
Looking at the result, I see the enabledSecurityGroup column is an Array holding the Security Group GUID and name. This is very well documented here: https://learn.microsoft.com/en-us/rest/api/fabric/admin/tenants/get-tenant-settings
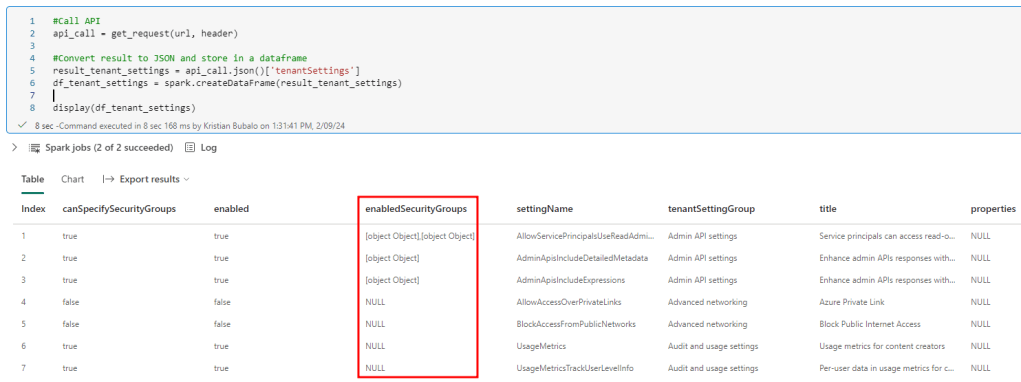
There are two possible ways to extract and store this data now. Either, I can create a separate DataFrame holding only the Setting and assigned Security Groups to it, or I wish to extract the values and pivot the result. This means I add two new columns – GUID and Name – and add one row for each Security Group within the Tenant setting. From a reporting point of view and following best practice for Star-Schema, I would def. recommend the first approach. Nevertheless, as we’re working here with a very small set of data, I choose the second option to easy things up. For that reason, I have to use the explode_outer function. “Explode” wouldn’t work as all settings without a Security Group assigned (null values) will be filtered out. On top, because I want to specify which columns my DataFrame should include, I create a new parameter called columns passing all the columns I’m interested in. Lastly, I name the two columns SGUID and SGName, where SG stands for Security Group.
#Specify Columns
columns = ["settingName", "title", "enabled", "tenantSettingGroup", "properties", "canSpecifySecurityGroups",]

df_tenant_settings = df_tenant_settings.select(
    *columns,
    explode_outer("enabledSecurityGroups").alias("Exploded_SG")
    ).select(
        *columns,
        col("Exploded_SG.graphId").alias("SGUID"),
        col("Exploded_SG.name").alias("SGName")
        )

# Show the result
display(df_tenant_settings)
I specifically didn’t add the enabledSecurityGroup column as it’s not needed anymore.
Checking the result now, I got everything I need and the values of SGUID and SGName are extracted.

As a last step, I create a third Notebook called “Save Tenant Settings”. In there, I call the Get Tenant Settings Notebook and add a second cell to save my DataFrame now as a Table in my Lakehouse with following code.
%run Get Tenant Settings#Save Dataframe as table to Lakehouse
df_tenant_settings.write.mode('overwrite').format('delta').saveAsTable('fabric_tenant_settings')This table can now also be used to track changes for example and get a notification if a Tenant Setting has been changed. Also, as all Security Groups are included, you can track if a SG is added or removed from a specific tenant setting.
I separated the last code specifically from the Get Tenant Settings Notebook to make sure I can run a save once needed and not every time I run the code. Further, I can leverage the Get Tenant Settings Notebook now for my diff analysis and notifications.
Let’s build a Diff Analysis
The beauty of spark is, how easy you can achieve your goal in some cases. To be able to create a Diff Analysis, we will need just a few lines of code. For that, I create a new Notebook called Diff Analysis Tenant Settings and execute the Get Tenant Settings Notebook in the first cell.
%run Get Tenant SettingsAfterwards, I select only the settingName column as this is my main focus.
#Select only settingName column
df_actual_tenant_settings = df_tenant_settings.select("settingName")
Next, I read the saved tenant settings and store them into a separate DataFrame. For my test purpose, I filter UsageMetrics out to make sure I have a difference. Obviously, this line should be deleted in a prod environment otherwise you’ll get always a notification.
#Read saved tenant settings to compare against
df_saved_tenant_settings = spark.sql("SELECT settingName FROM PBI_Guy_Lakehouse.fabric_tenant_settings")

#For testing purpose, filter out Usage Metrics. Delete this line for production environment
df_saved_tenant_settings = df_saved_tenant_settings.filter(df_saved_tenant_settings.settingName != 'UsageMetrics')
Lastly, I use the subtract function to compare the two DataFrames.
df_diff = df_actual_tenant_settings.subtract(df_saved_tenant_settings)
display(df_diff)
Showing the result, I see only UsageMetrics which I filtered out previously.

One last step we still need to do is to convert the DataFrame into a string, combining all rows comma separated, as the Data Pipeline, which we will create next, do not accept Arrays / Tables as Parameters as of writing this blog post.
from pyspark.sql.functions import concat_ws, collect_list

combined_string = df_diff.groupBy().agg(concat_ws(", ", collect_list("settingName")).alias("CombinedString")).first()["CombinedString"]

mssparkutils.notebook.exit(combined_string)
Now, let’s get notified
After the setup, the only thing missing is to get notified once a difference is analyzed. So let’s build a Pipeline for that! To do so, I select my Workspace, hit +New and select Data pipeline. If you don’t see it in the drop down menu, just select “More Options” and choose it from there. I name the pipeline “Notify new Tenant Settings” and hit create. In the ribbon, I choose “Notebook” as a first action and name it “Get Difference”.

Afterwards, I select the Settings tab and assign the Diff Analysis Tenant Settings to the Notebook action.

Next, I select in the Ribbon the Activities Tab and choose the Teams icon. Once the action is on the screen, I connect my Notebook action with the Teams action on success.

Lastly, I rename the Teams action to “Send Teams message” and switch to the Settings tab. In there, I have to sign in first by clicking the button. A Sign in window will pop up in which you have to sign in as well as allow access so that the Data Pipeline can send messages. After successfully giving access, I only need to specify in which Channel or Group Chat I wish to post the message and provide the Parameter from my Notebook action into the Teams message. I do that by switching to the Functions tab and add following code
@activity('Get Difference').output.result.exitValueI also provide a nice text in front and add the subject “Tenant Settings Difference”.
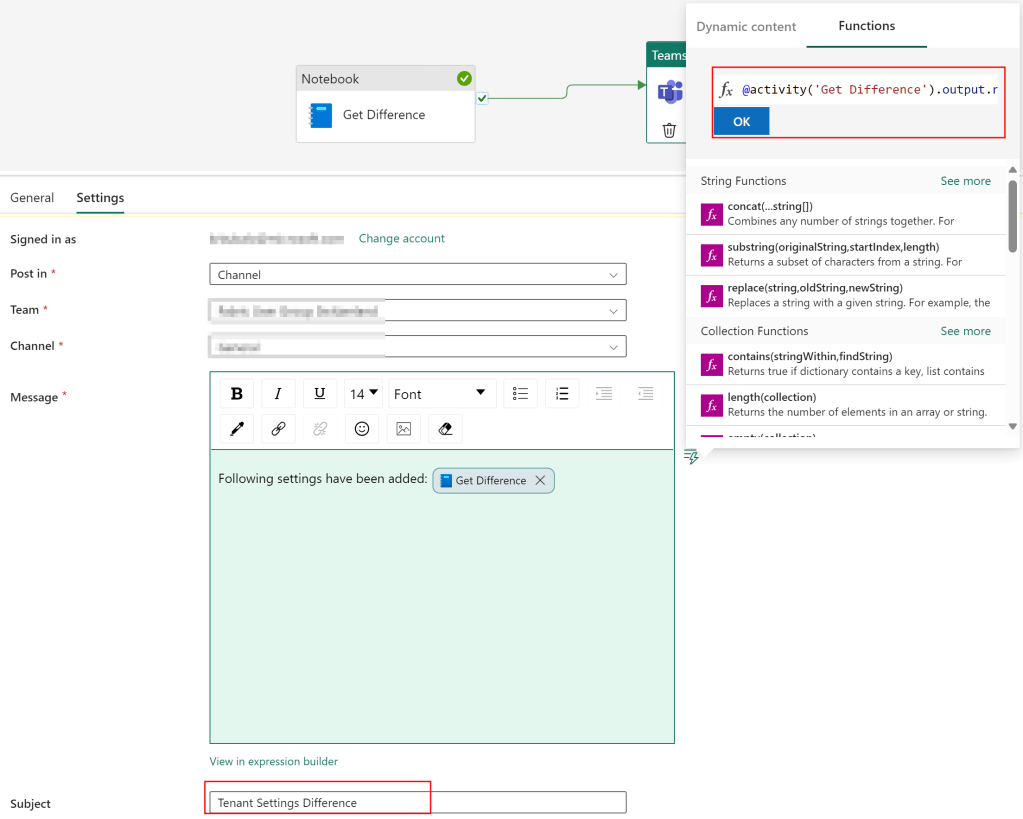
Now, I just hit the Run button in the Home Ribbon and wait until it’s executed. If everything works as expected, you’ll see a Succeeded status as well as the message in your Teams.


Some last thoughts
As I haven’t provided a logic to check if new settings are there, I’ll get a Teams notification after every run of the Pipeline. This means I would need to add an if else condition in front of the Teams Message activity to check if the string is empty or not. On the other hand, if I run the pipeline e.g. on a weekly base, I make sure no settings are added and I get notified about it – which I like more in my case.
Further, I’d need to set up a schedule to run the pipeline on a regular base. As this is straight forward and very well documented here (https://learn.microsoft.com/en-us/fabric/data-factory/pipeline-runs#scheduled-data-pipeline-runs), I’m not going to walk you through that as well.
And that’s already it! I can now get automatically notifications about new Tenant Settings.
Please let me know if this post was helpful and give me some feedback. Also feel free to contact me if you have any questions.
If you’re interested in the files used in this blog check out my GitHub repo https://github.com/PBI-Guy/blog
