Show “secured” Images in Power BI

Use Case

From time to time I got asked how you can display images in Power BI. The answer is pretty simple and straight forward (see https://docs.microsoft.com/en-us/power-bi/create-reports/power-bi-images-tables) if the image is publicly available. But customers can’t expose their internal pictures to the public and still want to display them in Power BI. The issue is with “secured” images that the Power BI visual can’t log in with an account to be able to display it. So how can you still save your images in a secured environment and still display them in Power BI? Let’s check it out.

I tried different ways and found two that work. One would be to get the binaries of each image, transform it to a text field and display afterwards with a custom visual the image. This solution has a big “but” from my point of view. Because the text field has a 32766 character limit you would either have to resize your image or you have to do some Power Query and DAX magic to split the field into multiple ones and add them afterwards together again. Chris Webb wrote a blog how this could be done here: https://blog.crossjoin.co.uk/2019/05/19/storing-large-images-in-power-bi-datasets/

As good as this solution might be I would like to find an easy, low-code / no-code way to achieve the same. And luckily there is one!

Power Apps & Power BI – Better Together

Because Power BI is part of the Power Platform and Microsoft offers a seamless integration into the other Services (and vice versa) let’s leverage the benefits of it and try to display our images through a Power Apps app in Power BI.

Prerequisites

To be able to implement the solution you would need a few things:

  • Power BI Desktop
  • Power BI Service Account (optionally)
  • Power Apps Account
  • SharePoint Document Library with pictures

The Power BI Desktop can be downloaded for free through the Power BI website. Power Apps is included in different licensing options like E3 or E5. In our case we’re going to use a SharePoint Connector which is a Standard Power Apps connector meaning no additional licensing is needed. If you don’t have a Power Apps license yet you can sign up for a Developer Plan and use to for development purpose. Keep in mind that you can’t share your apps created with a Dev. Plan nor can you show Power Apps apps in Power BI coming from this specific environment.

How to

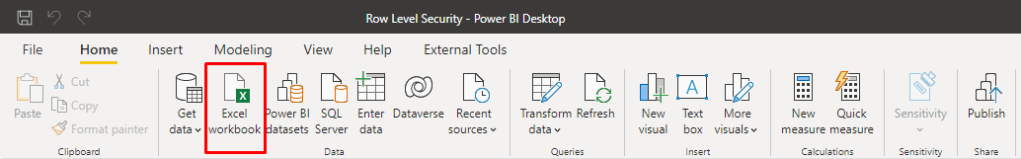
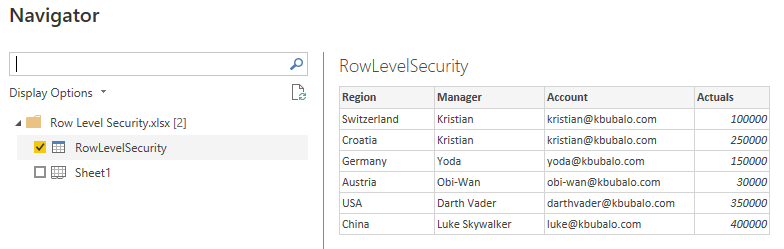
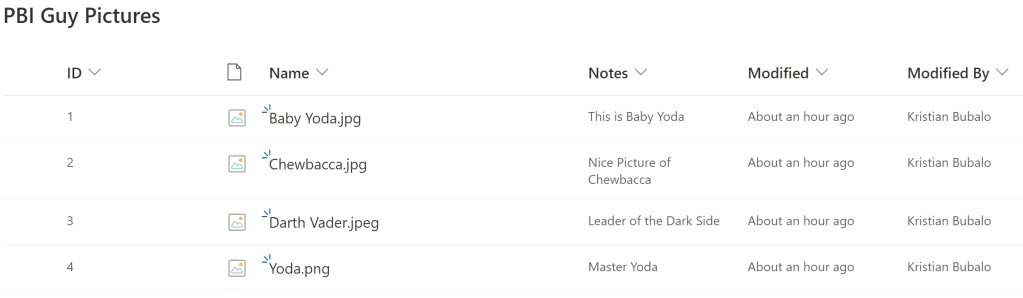
We start in Power BI Desktop and connect to our SharePoint list to get a few basic details. I’ll not guide you through how to connect to a SharePoint Document Library. These details can be found here. In my case I have a simple Document Library with some Star Wars picture.

In Power BI I connect to the Document Library and get only the ID, Notes, Created, Modified, and ServerRelativeURL fields. You can of course select more or less fields but make sure you get the ID which will be needed later on in the Power Apps app.

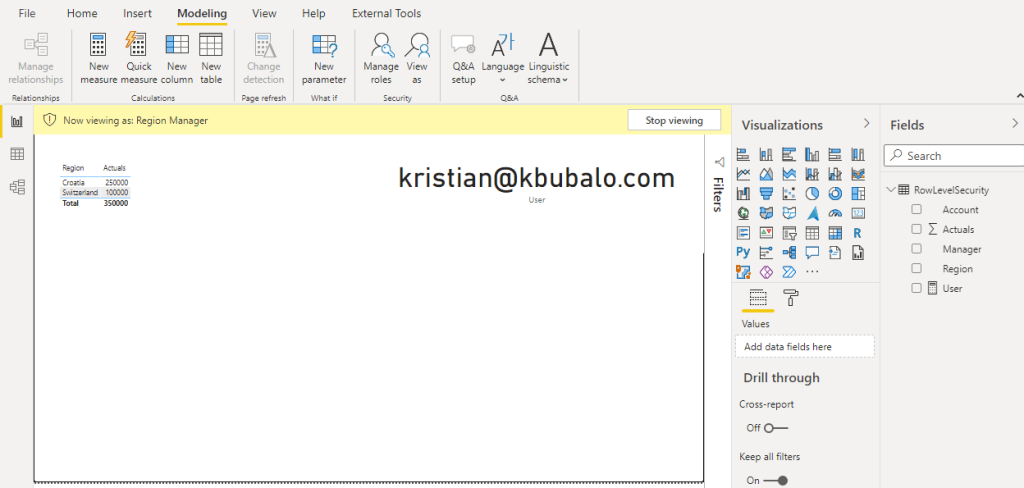
Once loaded I create a simple Table visual with the three fields ID, Notes, and ServerRelativeURL to display some data. As a next step I add the Power Apps Visual to my canvas and position it to the right. Once you added the Power Apps Visual you’ll see the necessary steps how to get started.

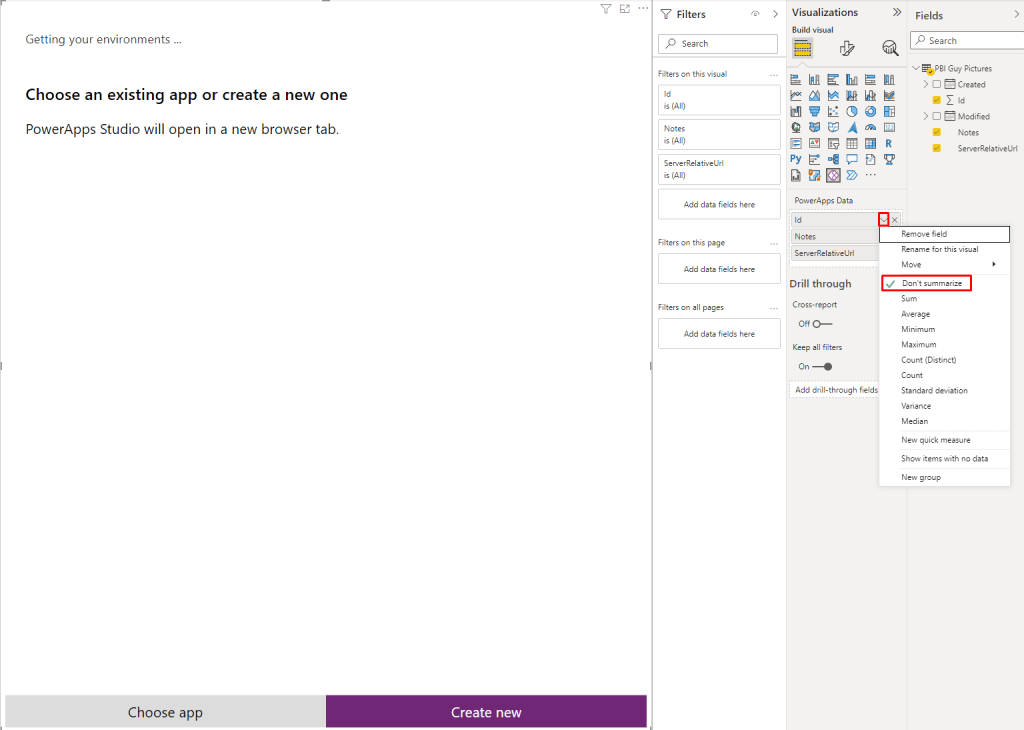
So let’s do our first step and add our wished fields to the data section of the visual. This fields can be accessed later on through Power Apps. Make sure to add the Id field and also check that it doesn’t summarize! The behavior (Sum, Count, etc.) will be provided to Power Apps and we don’t want to summarize our Ids. As soon as you add your first field the Power Apps visual will change where you can choose and existing app or create a new one. In our case we’re going to create a new one. A window will pop up asking if it’s ok to open your browser with the Power Apps URL. Hit OK.

Tip: If you’re facing some issues while opening Power Apps or you can’t choose your environment through the Visual, open Power Apps in your default browser, choose your environment in the browser, switch back to Power BI and try to hit the “Create New” button again.

Once Power Apps is loaded you’ll see an object call “PowerBIIntegration” (besides some others). This object has been automatically created through Power BI and makes sure that Power BI and Power Apps can interact with each other. This means for example if you select now a specific image to filter the same filter will also apply in Power Apps. That’s the reason why you have to start from Power BI and create an App from there. Otherwise the “PowerBIIntegration” object will not be created.

Let’s quickly test if the integration really works. I select the Baby Yoda picture in Power BI and the list is automatically filtered in Power Apps – great!

Our next goal is now to show the Images from SharePoint in our Power Apps app and make sure the integration still works (filter on a specific image in Power BI should also filter the Image in our app). Therefore we first have to create a connection to our SharePoint list. To do so go to the Data Tab in Power Apps and add SharePoint as data source.

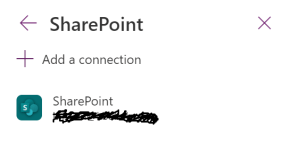
If you haven’t created a connection yet hit the “Add a connection” button. In my case I can choose an existing one.

Afterwards choose your Site and Document Library in which you stored your pictures. In my case I have a Doc Library called PBI Guy Pictures. I select it and hit “Connect”.

Now that we’re connected to our Doc Library we can display the images out of it. To do so insert a Gallery. I choose a vertical one but the layout can be modified afterwards as well.

Once inserted I adjust the two Galleries so that our freshly inserted one is at the top and at the bottom I display the first Gallery. Per default our new Gallery shows default text and images. We have to connect our Gallery to our SharePoint Doc Library and than decide what we wish to display. So let’s connect it by selecting the Gallery and set the Data source through the Properties pane.

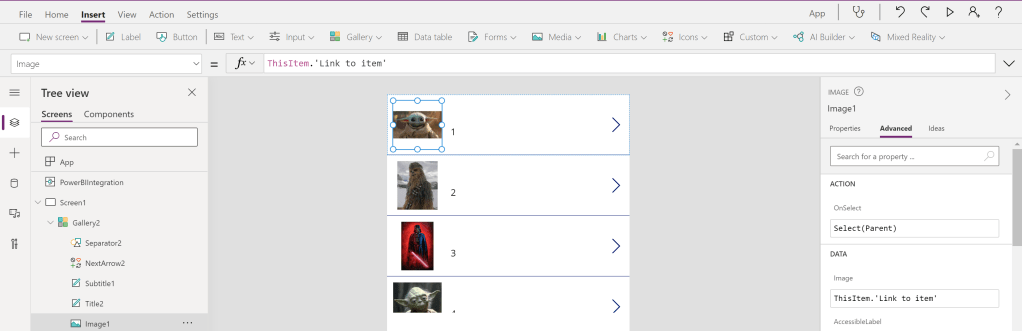
Our next step is to display the right image. Select the first image object in the Gallery and choose the “Items” property either on top left of the screen or find it in the properties pane in the Advanced section.

Replace “SampleImage” with ThisItem.’Link to item’ to create the link to our needed image.

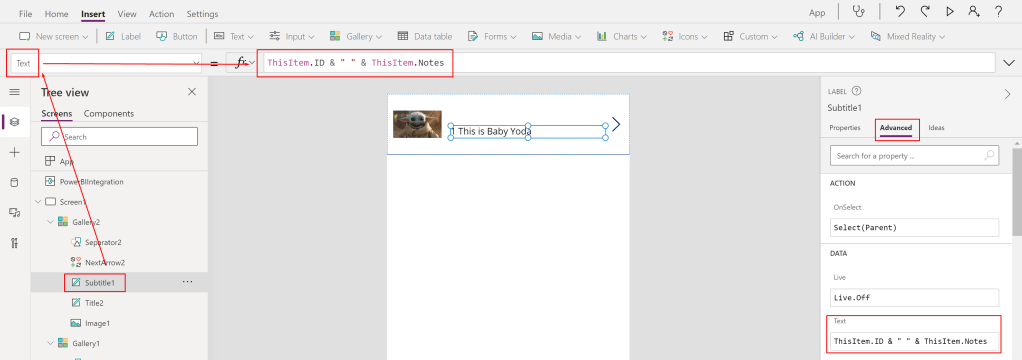
You can also modify the view of the Gallery, add new fields into it, etc. but in my case I just want to display my notes with the ID together. Therefore I select the ID Text Box and change the code in the function window from ThisItem.ID to ThisItem.ID & ” ” & ThisItem.Notes

Our last step is to create a connection between our SharePoint Gallery and the “Power BI Gallery” from the beginning so that filters from Power BI will effect our SharePoint Gallery as well. The best way to do so is to filter the new Gallery by an ID to make sure we got that one specific image we’re looking for. That’s the reason why we need our ID field from the beginning! 🙂

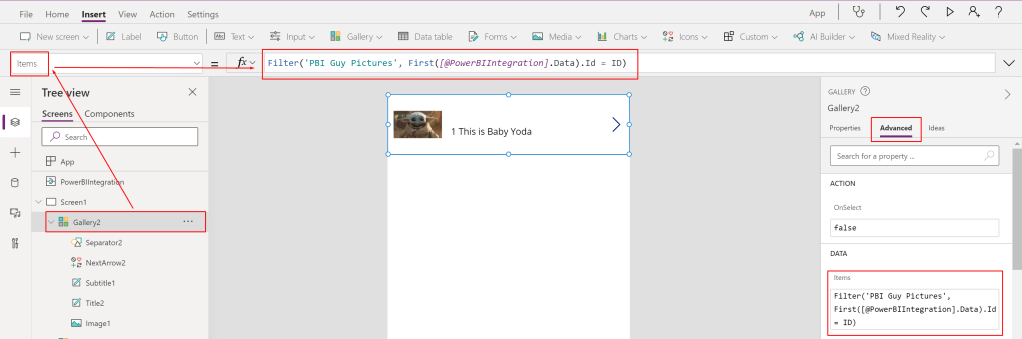
To filter the new Gallery select it and choose the Items property. In my case I see ‘PBI Guy Pictures’. This is the whole table we have to filter and making sure that only the selected ID is showing up. Therefore we wrap our Table with a Filter() statement. Our first argument in the filter statement is the ‘PBI Guy Pictures’ table. Our second argument is the filter condition which should point the ID field from Power BI to the ID field of SharePoint. Therefore we use the PowerBIIntegration object to grab the necessary data. Unfortunately this is a Table Data Type and we can’t match Table with a single Number Data Type. To get a single value I extract just the first value of the whole table with the First() statement followed with the column I’m looking for (ID in this case). Our whole function looks now as following: Filter(‘PBI Guy Pictures’, First([@PowerBIIntegration].Data).Id = ID) And I immediately see that it works! Previously I selected Baby Yoda and now only this picture is showing up.

As a last step I want to make sure the first Gallery is not visible in my app. So I select the first Gallery and set the Visible property to false.

Of course you can now modify your app and make it more shiny but just for the demo purpose I save it as it is now through File, Save. Once done the App is ready to be used in Power BI as well and the cross-filter works!

If you wish to share the report make sure all users have also access to the Power Apps app and the SharePoint Library. Otherwise people won’t be able to see the pictures in their report.

Please let me know if this post was helpful and give me some feedback. Also feel free to contact me if you have any questions.

If you’re interested in the files used in this blog check out my GitHub repo https://github.com/PBI-Guy/blog

Power BI Theme with Background Image

A few weeks ago I saw a small but very useful hack if you’re working with Power BI Themes. Did you know that you can create a Theme with a background image? Let me show you how!

What is a Theme in Power BI?

Power BI Report Themes helps you to apply design changes to your entire report. With a Theme you can specify what the default color of your visuals should be, changing icon sets, or applying default visual formatting like title text size. Further details can be found here: https://docs.microsoft.com/en-us/power-bi/create-reports/desktop-report-themes

Once a Theme is created you can save it as JSON file and distributed it to your whole organization. Like with every other JSON file you can of course modify it as wished. In our case we wish to add a background image because background images are not saved through the Desktop in the JSON file.

How to create a Theme

Once Power BI Desktop is opened select the View Tab, expand Themes, and hit Customize current theme.

A new window will pop up in which you can customize your current Theme. In my case I choose to go with darker colors in general. You can also customize your Text, Visuals, Page, and Filter pane. Once done hit the Apply button.

You’ll see now that the current Theme is used in your Power BI report. Last step is to save the current Theme as JSON.

If you wish you can try to add a background image in your report but this will not be saved in the Theme / JSON file.

Once saved I open the JSON file in Notepad++ and format it as JSON format through the JSTool plugin. As we can see the data colors has been saved in our JSON file (and nothing else).

To be able to add now a background image we need to add a code snippet and convert our background image to base64 format. Let me walk you through the steps. First, we add following code snippet after the dataColors line.

,”visualStyles”: {“page”: {“*”: {“background”: [{“image”: {“name”: “Demo”,”scaling”: “Fit”,”url”: “data:image/jpg;base64, ” },”transparency”: 50}]}}}

Now we can add our base64 formatted image after the comma of base64 but it has to be before the quote. To convert an image into base64 just search for an online service which can do so. In my case I’m using https://onlinejpgtools.com/convert-jpg-to-base64 and simply drag my image in the necessary field. Once done you’ll get the code right away on the right sight. Hit the “Copy to clipboard” button to have it in your clipboard.

The last step now is to paste the code in the needed code area (after the comma of base64, before the quote). I formatted my final code in Notepad++ to make it more readable and it looks like following now.

If your image is a PNG just replace the red marked part of your code to be PNG instead of JPG.

Finally I have to save my JSON file and import it into every Power BI report file I wish to use my new Theme.

As you can see the background image is saved within the Theme with the correct settings. In my case I set the transparency to 50%.

Please let me know if this post was helpful and give me some feedback. Also feel free to contact me if you have any questions.

If you’re interested in the files used in this blog check out my GitHub repo https://github.com/PBI-Guy/blog

Power BI Licensing

One of the most discussed topics with my customers and partners is Power BI licensing. Typical questions are

  • I want to create a report for my own use do I need a Power BI Pro license?
  • Does a report viewer also need a Power BI Pro license?
  • What if we have like 1000 Users does everybody need a Pro license?
  • What are the costs?

In this post I try to explain the different licensing options for Power BI. Further I’ll discuss some various scenarios and what kind of license would fit best.

First things first. We need to understand what kind of products Power BI has in his portfolio.

Power BI Products

Power BI Desktop

The Power BI Desktop is a client application in which you can author modern and interactive reports. You can save those files as a PBIX format. I’ll highly recommend to install and use it as you have the full flexibility to create your report and data model, and modify it as needed. For more information please visit https://powerbi.microsoft.com/en-us/desktop

Power BI Service

The Power BI Service is a cloud-based modern business analytics solution in which you can publish (PBIX files) or even create reports. Creating reports in the service is – as of today – limited comparing it to Power BI Desktop. For example you can’t use DAX to enhance your model in the browser. You can find more information on https://docs.microsoft.com/en-us/power-bi/service-get-started

Power BI Premium

Power BI Premium is a dedicated capacity for your organization. It has the same functionality as the Power BI Service but it gives you more consistent performance, larger data volumes, and the flexibility you need. See also https://powerbi.microsoft.com/en-us/power-bi-premium

Power BI Report Server

Instead of going to the cloud Power BI offers a on-premises Report Server on which you can publish and distribute your Power BI reports in-house. It does not have all services & features like the Power BI Service – like the natural Q&A – but most of it. Further information can be found here https://powerbi.microsoft.com/en-us/report-server

Power BI Embedded

If you would like to embed Power BI Reports in your own application then Power BI Embedded is the right choice. It’s designed for Independent Software Vendors (ISVs) and developers. More information can be found here https://powerbi.microsoft.com/en-us/power-bi-embedded

Power BI Mobile

Power BI Mobile offers you to connect to your data and see your reports on the go for any device. You can download the app from Microsoft, on the App Store, or Google Play. For more information please visit https://powerbi.microsoft.com/en-us/mobile

After we have clarified what kind of products are available let’s deep-dive into the different licensing options.

Power BI Licenses

Power BI Free

Power BI Desktop and Power BI Mobile are free for all users! Regardless of what other product (Power BI Service, Power BI Report Server, etc.) you are using those two are totally free. Further there is a limited Power BI Service free edition in which you can use following features: All Connectors, Publish to Web, and Export to PowerPoint, Excel, CSV. This means if I would like to create a report for myself I can download the Power BI Desktop, create a report, publish it to Power BI Service and use e.g. a Dashboard to combine different Reports. Further I can connect with my mobile device to Power BI Service and see my dashboard on the go. Awesome! The Power BI Free license is still required so an user can log in into the service. With the Power BI Free license Microsoft makes sure that the org admin has allowed access to Power BI Service in general for the specific user.

Power BI Pro

As mentioned Power BI Desktop and Power BI Mobile are free for all users but the Power BI Service free edition does not have all features covered. One of the most asked one is the “Peer-to-peer sharing” feature which allows me to share my Dashboards, Reports, and Datasets with other users. To be able to do so I, the author, have to have a Power BI Pro license regardless if my organization uses Power BI Service, Power BI Premium, Power BI Embedded, or Power BI Report Server. For the viewer of the report it depends what the company has decided to use. If Power BI Service is the chosen one then the viewer has to have a Power BI Pro License as well. If Power BI Premium or Power BI Report Server is in use than a consumer needs a Power BI Free License. Even if the License itself is free an administrator has to assign it to the user. For more information and a comparison between Free and Pro please visit https://docs.microsoft.com/en-us/power-bi/service-free-vs-pro

Power BI Premium

Power BI Premium is a capacity pricing variant. There are different sizes (cores) available. The Whitepaper can be downloaded here. Capacity pricing means that not all users need a License. Only the author has to have a Power BI Pro License. All viewers / consumers do not need a Pro License but the admin has still to assign a Free License to all needed users.

Power BI Premium per User

Power BI Premium Per User allows organizations to license Premium features on a per-user basis. Premium Per User (PPU) includes all Power BI Pro license capabilities, and also adds features such as paginated reports, AI, and other capabilities that are only available to Premium subscribers. More information can be found here: https://docs.microsoft.com/en-us/power-bi/admin/service-premium-per-user-faq

Power BI Report Server

An organization can purchase Power BI Report Server in two different ways: By using Power BI Premium you are also allowed to use Power BI Report Server or you have a SQL Server Enterprise Edition incl. Software Assurance. In both cases an author still needs a Power BI Pro License to share Power BI Reports. Viewers don’t need a license at all.

Power BI Embedded

With Power BI Embedded you are allowed to embed Power BI Reports into your own application. Depending on which License type (A, EM or P SKU) you are using viewers need a Power BI Free License assigned (EM or P SKU) or you have to manage authentication within your application (A SKU). In both cases an author still needs a Power BI Pro License to share reports. For more information please visit https://docs.microsoft.com/en-us/power-bi/developer/embedded-faq

Phu! That has been a lof of information! Let’s discuss now some various scenarios and see which Product would fit best and which License is needed.

Scenarios

Luke testing for himself

Let’s imagine Luke would like to build some Reports for himself. He would like to connect to different data sources like Excel, CSV, SQL Database and Google Analytics. Further he would like to build a Dashboard and connect to it with his tablet and mobile device.

In this case he will use Power BI Desktop to create and publish reports, Power BI Service to build Dashboards and Power BI Mobile to connect with his mobile device or tablet to his Dashboards. Everything is possible with the Power BI Free License.

Obi-Wan would like to see Luke’s Dashboard

Luke is so excited about Power BI and his Dashboard he would like to show it to Obi-Wan. Obi-Wan shouldn’t be able to change anything in the report therefore Luke wants to share it within the Power BI Service with him.

Luke and Obi-Wan will both use the Power BI Service and both need a Power BI Pro License to share and view the Dashboard.

Luke would like to leverage some Premium features and share it with Obi-Wan

Luke would like to enhance his report with some out-of-the-box AI capabilities that Power BI Premium offers. But just for the two of them it doesn’t make sense to purchase Power BI Premium. Therefore Luke decided to leverage the Power BI Premium per User license to get the Premium features like AI, paginated reports, and other capabilities.

Because Luke would like to leverage Premium features he need a Power BI Premium per User (PPU) license. Because he wishes to share it with Obi-Wan, he also needs a PPU license due to the fact that Premium features are used and a Pro license is not sufficient. The matrix below will clarify which license type can view / access what kind of content.

Chart of which users can see content based on license types

The Rebels are interested in Luke’s Dashboard

Luke and Obi-Wan are both so excited about the possibilities of Power BI that they are telling everybody about it. Therefore the interest is growing and nearly every Rebel would like to see Luke’s Dashboard. Because of the growing interest, the huge number of viewers, and the more and more complex Dashboards Luke thinks a dedicated capacity would make sense.

In this scenario Luke would go for Power BI Premium. This means he has to republish his report from Power BI Desktop to the Premium capacity (or assign the existing workspace to a Premium node) and make it available for all Rebels incl. Obi-Wan. Because the Rebels are now using a Premium capacity non viewer needs a Power BI Pro License but Luke has still to assign a Free License to each user. Instead of doing it for each user separately he decides that every user can sign up individually for Power BI (Settings in Power BI admin portal). This reduces the burden for Luke.

The Senators pass a new galaxy data protection regulation (GDPR)

The Galactic Senators pass a new law which strictly forbid to use and show personal data without the approval of the person itself. Luke doesn’t want to take any risks and decides to go on-premises instead of the cloud until the Rebels clarify if they are allowed to use all personal data.

Luke installs a Power BI Report Server on which he publish his Report from Power BI Desktop. Further he added all users to the Report Server, shares his Report, and deletes the Dashboard, Report and Datasets in Power BI Service and Power BI Premium to make sure everything is by law. In this case Luke needs a Power BI Pro License to share his report while all other users as viewers need only a Power BI Free License. Further because they already purchased Power BI Premium the Rebels are allowed to use the Power BI Report Server as well.

R2D2 should show Power BI Dashboards

Luke would like to enable R2D2 to show his Dashboard. To do so he goes for Power BI Embedded.

Because Luke would like to show his Dashboard on his own application (or android 🙂 ) he needs to have Power BI Embedded. Further he doesn’t need any Power BI Service graphic user interface (GUI) therefore the A SKU is enough. But Luke still needs a Power BI Pro License to be able to share his Dashboard with others while all viewers do not need any License at all this time.

Now that we clarified what kind of products and Service Power BI offers as well as how to license them properly let’s have a look at the cost. I’ll use list prices publicly available from the Power BI website. Keep in mind that the prices can change.

Power BI License Cost

Power BI Desktop

As mentioned during the post Power BI Desktop is absolutely free and can be used without any cost.

Power BI Mobile

The Power BI App for your mobile device is also free.

Power BI Free License

The Power BI Free license is, as the name says, as well free and has no costs.

Power BI Pro License

The Power BI Pro License costs $9.99/User/Month. This means if you have for example five users and everyone will require a Pro license your monthly cost will be $49.95$ for the five users.

The Pro license can be purchased as stand alone or through E5 as Power BI Pro is included in E5.

Power BI Premium per User

The PPU License costs $20/User/Month. If you already have a Pro License you just need the add-on which is $10/User/Month. Imagine having seven users with a Pro License and ten users with a Free License and all of them require now a PPU. In this case you would need to purchase the add-on for seven users (7x$10) and ten PPU stand alone Licenses (10x$20) which means you’ll have a total cost of $339.93 (7x$9.99 Pro License + 7x$10 Add-on + 10x$20)

Power BI Premium

If you’re interested in Power BI Premium the smallest SKU (P1 with 8 v-cores) costs $4’995.- per month. From a purely cost perspective this makes sense if you have 500 or more users. This 500 users break-even-point can be easily calculated by dividing the Premium costs by the Pro License costs: 4995 / 9.99 = 500. Keep in mind that there are more reasons to go for Premium than just cost!

Imagine if you have to share a report with 600 users. In such a scenario every user would require a Pro License if you share it through Power BI Service. Therefore the total cost for these 600 users would be $5’994.- per month (600x$9.99). As we see it would make more sense to purchase Power BI Premium and assign a Pro License just to the developers of the report (let’s say 10 developers). In this case the total cost would be $5’094.90 (10x$9.99 + $4’995) and we saved roughly $900 per month!

Power BI Report Server

Power BI Report Server is included in Power BI Premium or through SQL Server Enterprise Edition with SA. In the first case, included in Premium, the minimal cost is therefore $4’995.- per month (P1 SKU with 8 v-cores). Just to point out that if you purchase Power BI Premium P1 you can use Premium and install a Power BI Report Server on top of it 8 cores in-house and use in total 16 cores!

If you’re interested in SQL Server Enterprise Edition with SA best would be to contact your Microsoft representative.

Power BI Embedded

Power BI Embedded is a Microsoft Azure Service and will charge you as long as it runs. Once you stop the Service there are no costs at all. The smallest SKU A1 is roughly $740 per month if it runs 24/7. A detailed price list can be found at https://azure.microsoft.com/en-us/pricing/details/power-bi-embedded/

Conclusion

I think the most important information is regardless of which product you are using (Power BI Service, Premium, Report Server or Embedded) as soon as you would like to share a Report you will need a Power BI Pro License. For the viewer it depends on which product the report is published. In Power BI Service a viewer also needs a Power BI Pro License, in Premium and Report Server a Free License is enough. For an embedded scenario a Free (A SKU) or non License (EM or P SKU) is required. Lastly, if Power BI Premium per User license is used by the author all viewers will also require the PPU license.

To get a better overview of the estimated cost I created a Power BI Report which you can use to calculate your cost based on the number of Power BI Developers and Viewers. Keep in mind Power BI Premium offers more features and could be useful not only to save cost! Check it out here.

Please let me know if this post was helpful and give me some feedback. Also feel free to contact me if you have any questions.

If you’re interested in the files used in this blog check out my GitHub repo https://github.com/PBI-Guy/blog

Power BI Row-Level-Security Organizational Hierarchy

In my first blog I showed how easy it is to set up RLS in general. This works perfectly fine if you’re working with a flat hierarchy. but what if it’s not flat? How to handle it? This post will show you how!

A common scenario is that a manager would like to see his and of his employees’ specific data like salary but of course the employees itself are only allowed to see their salary or from their employees below them in the org chart.

In my fictional organization Yoda is the top manager. Obi-Wan and Leia are on level 2 and each of them has two more employees (level 3). Yoda should be able to see his salary and every other as well. On the other side Obi-Wan has only the permission to see his and his employees’ salaries (Darth Vader and Luke Skywalker). Same goes for Leia. All level 3 employees mustn’t see level 1, 2, or from other people on their level. Therefore they are only allowed to see their own salary.

I created an example in Excel in which we have two tables. One (Table name Salary) with Employee ID, Manager ID and Salary. The other one (Table name Manager) with Employee ID, Employee Name and AD Account.

Now I open Power BI and connect to my Excel sheet. Once my table is loaded I check the relationship if the two tables “Salary” and “Manager” are correctly joined. Looks good so far.

Hint: If Power BI do not create a relationship automatically just create a new one by selecting Employee ID and drag and drop to the other field Employee ID.

My next step is to show the employees ID, employees name, salary, Manager ID and AD Account in a table to keep track if my data are shown correctly. Make sure employee ID and manager ID is not summarized.

My next step is to create a new column and add a so-called PATH function in my salary table. This function allows me to see the whole hierarchy path of each employee. I rename the column to “Hierarchy Path” and add the PATH function as follows: PATH(Salary[Employee ID], Salary[Manager ID]). As a result I get the whole hierarchy path for each employee separated by |.

My next step is to identify which user is logged in right now. To do so I add a new Measure in my Manager table and use the USERPRINCIPALNAME() function. My Measure is called User ID.

Because I do know now who is logged in I can match the AD Account and look which ID the user has. The function LOOKUPVALUE helps me to get the right information. Therefore I create another measure in my Salary table, call it Current User ID and use the following statement: LOOKUPVALUE(Salary[Employee ID], Manager[AD Account], [User ID]). To check if the correct user ID is taken I display my new measure in a table with the User ID. Yoda has the right Current User ID as we can see.

My final step is to add a new Role to manage the permission. I add a new one by selecting Manage Roles in the Modeling Ribbon, hit Create, rename it to Hierarchy and select the Salary table. At this point I add a new function called PATHCONTAINS which checks if something is inside a path – exactly what we are looking for because we have the whole hierarchy structure of each employee (function PATH) and we have also the current user ID (see LOOKUPVALUE). All we have to do now is to combine those bits of information like PATHCONTAINS([Hierarchy Path], [Current User ID]) = True.

My organizational hierarchy RLS is set up and should work! Let’s test is. As Yoda I should be able to see everything. I create a new table with Employee ID, Name and Salary. Afterwards I activate the Hierarchy role under View as Roles. Power BI notifies me that I’m viewing the Report in the role of Hierarchy. Nothing has changed so far because I can see everything as Yoda.

Now let’s change the user role. Right now I’m viewing my report as Yoda. Let’s try out Obi-Wan.

It works! Let’s test the last scenario with Darth Maul.

As we can see it works perfectly fine! With three simple functions I make sure that the permission is set up correctly and users can only see what they are allowed to see. Great!

In my next post I’ll show how to configure RLS properly in the Service.

Please let me know if this post was helpful and give me some feedback. Also feel free to contact me if you have any questions.

If you’re interested in the PBIX and Excel file used in this blog post check out my GitHub repo https://github.com/PBI-Guy/blog

Power BI Row-Level-Security

You would like to create a Power BI Report but not every user should see everything? Copying & sharing the report with individuals would be tough to maintain but not sure which other opportunities do you have? Row-Level-Security could be the answer!

In my first post I would like to demonstrate how easy a Row-Level-Security can be implemented.

First things first: I created a simple Excel Sheet which has different Regions, Managers, their internal mail and actuals for each region.

I open my Power BI Desktop and connect to the excel file.

In this demo I renamed my table inside Excel to “RowLevelSecurity” so I select it and hit load.

Now, I have connected to my Excel file and imported the data. As next step I would like to see which user is signed in to create a Row-Level-Security in a second step. I have now two options to do so:

  1. Create a measure with the user name
  2. Pass the function to call the user name directly in the role management

In my scenario I would like to create a measure. So I select “New Measure” in the Start Ribbon.

Now I can create a new Measure in which I can use DAX expressions. I find it also immediately in my table.

Because “Measure” is not an appropriate name I rename it to “User” and set it equal to USERPRINCIPALNAME. As soon as I start to type Power BI will recommend all functions which starts with “User”. After selecting USERPRINCIPALNAME I hit enter to save my measure.

Es wurde kein Alt-Text für dieses Bild angegeben.

To make sure I have the right function and the right user I check it by selecting my new measurement and use the “Card” Visual. Looks good so far.

Now I have to match my user with the Excel sheet and create a Row-Level-Security. To do so I hit “Manage Roles” in the Ribbon tab “Modeling”.

I can create a new role by hitting “Create”. I rename my new role to “Region Manager” and select the three dots at RowLevelSecurity. Here I can choose which field I would like to check with the current user. In my demo the user has to match with the “Account” field so I select it.

Last but no least I have to match the Account with my new created Measure “User”. To do so write [User] – it has to be in brackets – check and save it.

To check if my new created role works fine I hit “View as Roles” in the Modeling Ribbon.

A window pops up in which I can choose which role I would like to activate and also check what another user will see. I select Region Manager and hit OK.

To test it I create a new table visual with Region and Actuals and magic happens – it only shows my rows!

To make it 100% sure I also test another user. To do so I go back to “View as Roles” and test is as Yoda.

It works perfectly fine!

Thanks to Row-Level-Security I do not have to replicate my Power BI reports and share it with individuals to make sure who can see what!

In my next post I’ll show you how to set up RLS with a hierarchy.

Please let me know if my first post was helpful and give me some feedback. Also feel free to contact me if you have any questions.

If you’re interested in the PBIX and Excel file used in this blog post check out my GitHub repo https://github.com/PBI-Guy/blog