Power BI and Activity Logs with Python

One of the most asked questions when I talk with Power BI Admins / Service Owners is how can they analyze which reports are (most) used. Power BI respectively Microsoft offers you different ways to get such insights. In this blog post I’ll give you an overview of the different ways and walk you through how to leverage the Power BI Admin REST API with Python to extract log files and analyze them – obviously – with Power BI.

What’s available

Here is a quick overview of different ways to get an usage metric of one or multiple reports.

  • Usage Metrics
  • M365 Audit Logs
  • Power BI & Azure Log Analytics
  • Power BI & PowerShell
  • Power BI REST API

Let’s explore them in more details. First of all the Usage Metrics which is out-of-the-box available in Power BI Service. As of this writing we differentiate between the classic workspace and new workspace Monitor Usage. Both of them gives you insights about the usage of your report. For example you can see how many views, unique viewers, and viewers per day for the specific report. Further, you could edit the report and delete the filter to get an overview of all reports within the same workspace. Unfortunately it’s not possible to have one Usage Metrics report across different workspaces this way which is therefore not the best solution for admins to get a total overview. Lastly, the Usage Metrics gives you an overview of the last 90 days, not more.

Going further with M365 Audit Logs. Each user, who have View-Only Audit Logs, Audit Logs, Global Admins, and/or Auditors permissions, have access to the general M365 Audit Log files. Power BI, like any other M365 service, logs all kind of different activities in the M365 Audit Log for the last 90 days. Therefore you can go the the M365 Compliance Center – Audit and search on different Activities. In the screen shot below I’m searching for Viewed Power BI report and get a result per Date and Time of the different Reports users have accessed (viewed). If wished I can download the result as CSV.

As nice as this possibility is there are two pain points from my point of view. First, if I have the sufficient rights to access the Log Files I have access to every log entry from any other M365 Service as well (e.g. SharePoint Online, Exchange Online, Dynamics 365, etc.), not only Power BI. Secondly, it’s a manual process. As Patrick from Guy in the Cube says: I’m not lazy, I’m efficient. And every manuel process is not really efficient. Therefore let’s explore the other ways, probably we find a better solution.

Since June 2021 you can connect an Azure Log Analytics Workspace with a Power BI Workspace to store automatically activity information. The beauty of this way is that once set up, you don’t have to run any kind of script or do something manually as everything is automatically saved in Azure Log Analytics. Further, it’s just storing Power BI related data and you don’t have access to other Microsoft Services logs. The downside is that Power BI Premium (per Use) and Azure Log Analytics is required, which can increase your costs. Costs for Log Analytics are, from my point of view, not that high. It starts already at $2.76 per GB but still it has to be considered. Prices for Azure Log Analytics can be found here. Another limitation (as of writing this post) is, that you can connect only one Power BI Workspace with one Azure Log Analytics workspace meaning you would need to create one Azure Log Workspaces per Power BI Workspace to store the log data. Of course you can combine it afterwards in Power BI or other tools but it’s still not on one central place. How to use and set up Azure Log Analytics with Power BI can be found here.

Moving on to the next possibility of using PowerShell to extract the log files. Instead of manually extracting the Log File in the Microsoft Compliance Center, as seen above, you can also create a PowerShell script to automatically get the needed data. Microsoft offers a good documentation (see here) how to use it and what’s required. One important thing to keep in mind is that you have two different cmdlet to get your data. One is the Power BI Activity Event (Get-PowerBIActivityEvent) and the other is the Unified Audit Log (Search-UnifiedAuditLog). The first one will give you only Power BI-related data for the last 30 days while the Unified Audit Log will give you access to the whole audit log for the last 90 days. This means you could also get data from other Microsoft Services, not only Power BI. Therefore you’ll find a filter option with the Unified Audit Log to get only Power BI related data (see screen shot below, marked with a red line).

I tested successfully the Unified Audit Log cmdlet as you can see below. I extract one file for the last 90 days in this example but of course you can extract only one day and run the script on a daily basis to get a history of your data (see line #20 in script) The whole script is of course in my GitHub repo.

The best part of this approach is that you can specify what exactly you wish to export – not only Power BI related logs. Further if you’re exporting it on your own you can choose how to store the data (CSV, Excel, Database, etc.) and create a historization. But like with manually extracting the log files you would require sufficient permissions. If you would use the Power BI Activity Log (Get-PowerBIActivityEvent) you won’t have access to the whole log file and you would only require Power BI Admin, Power Platform Admin, or Global Admin rights. And of course you would require some tech skills for this approach to create and use a PowerShell script but even myself with some guidance from Bing and YouTube could create such a script to extract the data and store it as CSV file. 🙂

Lastly, if you’re more familiar working with REST APIs the last option would be your preferred way. As in the document stated Power BI offers a REST API to get Activity Events. Let me walk you through how you can leverage the API with Python and store the data into an Azure Data Lake Gen2 to analyze it afterwards with Power BI.

Requirements

  • Create / Use a Service Principal
  • Enable Service Principals rad-only access to Power BI admin API in Tenant Settings
  • Azure Data Lake Gen2
  • Python Skills
  • Understanding REST APIs

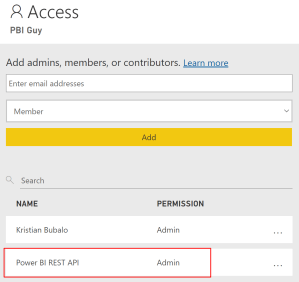
First of all let’s make sure we have the sufficient permission to run our Python script. Because I wish to automate it and I don’t wish to use my personal account I’ll need a Service Principal. How to register an App / create a Service Principal can be found in this guide. But let me walk you through as well. Log in into your Azure Portal, search for “App Registration” and hit “New Registration”. Give your app a name and select the supported account type (I choose the first option, only Single Tenant). In my case I called my Service Principal “Power BI REST API”.

Note: No API permissions are required as the application’s Azure AD permissions will have no effect. The application’s permissions are then managed through the Power BI admin portal.

Afterwards I created a Security Group called Power BI REST API and added my Service Principal to the group.

Next, we have to make sure that Power BI in general allows Service Principals to use the Power BI Admin REST API. To do so I log in to Power BI, go to the Admin Portal and Enable in the Admin API Settings the necessary feature. Once enabled I add my Power BI REST API Security Group.

Now that we’re ready and have the sufficient permission let’s create our Python script. I’ll do so in the Azure Synapse environment but of course it would also work in any other tool like Visual Studio Code.

As usual with Python let’s import the needed libraries first. In this case we need following libraries:

  • msal
    This is the Microsoft Authentication Library which we use to authenticate against Power BI.
  • requests
    I’m using the requests library to send my REST API requests.
  • json
    Because the result from the REST API is a JSON format I’m using this library to read the result.
  • pandas
    With this library it’s very easy to create tables (dataframes) and store them afterwards.
  • date & timedelta from datetime
    I need the current date to be able to automate my script and run it on a daily base.
#Import necessary libraries
import msal
import requests
import json
import pandas as pd
from datetime import date, timedelta

Afterwards let’s parametrize our script. First thing, let’s get yesterdays date. Because I want to run the script in the morning, it doesn’t make sense to use the current date as not much have happened. Therefore I’m focusing on the day before with following code:

#Get yesterdays date and convert to string
activityDate = date.today() - timedelta(days=1)
activityDate = activityDate.strftime("%Y-%m-%d")

I’m converting the date into a string in the format of YYYY-MM-DD which is required for the REST API call. Our next step is to make sure we can authenticate with our Service Principal. For that we need the Client ID, Client Secret, Authority URL, and the Scope. If you head over to the Azure Portal where the Service Principal was created (Search for “App Registration”) you’ll find the Client ID in the Overview pane.

To create a Client Secret hit the Certification & Secrets tab and choose New client secret. Configure and add a description and wished. Once created make sure to copy the value because afterwards it won’t be visible anymore and you would need to create a new secret.

For the Authority URL please us https://login.microsoftonline.com/ adding your tenant name at the end. In my case it’s kbubalo.com. Lastly we need the scope which is https://analysis.windows.net/powerbi/api/.default

#Set Client ID and Secret for Service Principal
client_id = ""
client_secret = ""
authority_url = "https://login.microsoftonline.com/kbubalo.com"
scope = ["https://analysis.windows.net/powerbi/api/.default"]

Now let’s set up the REST API URL which we’re calling to get our Activity Data. Looking at the doc here or in the Power BI Admin REST API doc here we see the main request is GET https://api.powerbi.com/v1.0/myorg/admin/activityevents following with the start and end datetime parameter. Because we parametrized our start and end date my URL parameter in Python looks as following:

#Set Power BI REST API to get Activities for today
url = "https://api.powerbi.com/v1.0/myorg/admin/activityevents?startDateTime='" + activityDate + "T00:00:00'&endDateTime='" + activityDate + "T23:59:59'"

As you see we’re adding the time at the start and end date to get the whole day.

Lastly we specify one more parameter for my CSV path where we wish to store the file.

#Set CSV path
path = 'abfss://powerbi@aiadadlgen2.dfs.core.windows.net/Activity Log/'

Now that we parametrized everything that we need let’s create our Python code. First thing to do is to authenticate against the Power BI Service to make sure we can call the REST API. Therefore I’m using the msal and my parameters to authenticate and store the result into a result parameter.

#Use MSAL to grab token
app = msal.ConfidentialClientApplication(client_id, authority=authority_url, client_credential=client_secret)
result = app.acquire_token_for_client(scopes=scope)

If we receive and access token, we would like to proceed calling our Power BI REST API. From the result we have to extract the access token, which will be used to call the REST API, and specify the header. Once done, we can call the REST API URL specified above with the requests.get method.

#Get latest Power BI Activities
if 'access_token' in result:
    access_token = result['access_token']
    header = {'Content-Type':'application/json', 'Authorization':f'Bearer {access_token}'}
    api_call = requests.get(url=url, headers=header)

Reading the doc it says following:

Microsoft Doc

If the number of entries is large, the ActivityEvents API returns only around 5,000 to 10,000 entries and a continuation token. Call the ActivityEvents API again with the continuation token to get the next batch of entries, and so forth, until you’ve gotten all entries and no longer receive a continuation token. The following example shows how to use the continuation token. No matter how many entries are returned, if the results include a continuation token, make sure you call the API again using that token to get the rest of the data, until a continuation token is no longer returned. It’s possible for a call to return a continuation token without any event entries. […]

Therefore we have to call the continuation URL as long as one is given and we wish to store the already called data of course to not lose them. Because of that we create an empty Pandas Dataframe in which we can append our results from each call. Further we store the continuation URL into a parameter and the first result into a second data Dataframe which we append to our empty one. Afterwards we have to do a while loop until no continuation URL is available anymore. Obviously we need to store from each call again our result into a Dataframe and append it to our first (now not empty anymore) Dataframe. Lastly we specify as Dataframe Index the Id URL.

    #Specify empty Dataframe with all columns
    column_names = ['Id', 'RecordType', 'CreationTime', 'Operation', 'OrganizationId', 'UserType', 'UserKey', 'Workload', 'UserId', 'ClientIP', 'UserAgent', 'Activity', 'IsSuccess', 'RequestId', 'ActivityId', 'ItemName', 'WorkSpaceName', 'DatasetName', 'ReportName', 'WorkspaceId', 'ObjectId', 'DatasetId', 'ReportId', 'ReportType', 'DistributionMethod', 'ConsumptionMethod']
    df = pd.DataFrame(columns=column_names)

    #Set continuation URL
    contUrl = api_call.json()['continuationUri']
    
    #Get all Activities for first hour, save to dataframe (df1) and append to empty created df
    result = api_call.json()['activityEventEntities']
    df1 = pd.DataFrame(result)
    pd.concat([df, df1])

    #Call Continuation URL as long as results get one back to get all activities through the day
    while contUrl is not None:        
        api_call_cont = requests.get(url=contUrl, headers=header)
        contUrl = api_call_cont.json()['continuationUri']
        result = api_call_cont.json()['activityEventEntities']
        df2 = pd.DataFrame(result)
        df = pd.concat([df, df2])
    
    #Set ID as Index of df
    df = df.set_index('Id')

Side note: During the creation of the Python Code I called the REST API for test purpose to make sure it works. During the test phase I received a result with all the columns. That’s the reason why I know which columns and in which order I have to create the empty Dataframe.

Our last step is to save our Dataframe into our ADL Gen2. This is very simple with Pandas Dataframe:

    #Save df as CSV
    df.to_csv(path + activityDate + '.csv')

Make sure to add “.csv” at the end to have the proper file type.

That’s it! Our whole code is done. Let me copy it for you so you have for sure the whole code in proper order.

#Import necessary libraries
import msal
import requests
import json
import pandas as pd
from datetime import date, timedelta

#Set parameters

#Get yesterdays date and convert to string
activityDate = date.today() - timedelta(days=1)
activityDate = activityDate.strftime("%Y-%m-%d")

#Set Client ID and Secret for Service Principal
client_id = ""
client_secret = ""
authority_url = "https://login.microsoftonline.com/kbubalo.com"
scope = ["https://analysis.windows.net/powerbi/api/.default"]

#Set Power BI REST API to get Activities for today
url = "https://api.powerbi.com/v1.0/myorg/admin/activityevents?startDateTime='" + activityDate + "T00:00:00'&endDateTime='" + activityDate + "T23:59:59'"

#Set CSV path
path = 'abfss://powerbi@aiadadlgen2.dfs.core.windows.net/Activity Log/'

#Use MSAL to grab token
app = msal.ConfidentialClientApplication(client_id, authority=authority_url, client_credential=client_secret)
result = app.acquire_token_for_client(scopes=scope)

#Get latest Power BI Activities
if 'access_token' in result:
    access_token = result['access_token']
    header = {'Content-Type':'application/json', 'Authorization':f'Bearer {access_token}'}
    api_call = requests.get(url=url, headers=header)

    #Specify empty Dataframe with all columns
    column_names = ['Id', 'RecordType', 'CreationTime', 'Operation', 'OrganizationId', 'UserType', 'UserKey', 'Workload', 'UserId', 'ClientIP', 'UserAgent', 'Activity', 'IsSuccess', 'RequestId', 'ActivityId', 'ItemName', 'WorkSpaceName', 'DatasetName', 'ReportName', 'WorkspaceId', 'ObjectId', 'DatasetId', 'ReportId', 'ReportType', 'DistributionMethod', 'ConsumptionMethod']
    df = pd.DataFrame(columns=column_names)

    #Set continuation URL
    contUrl = api_call.json()['continuationUri']
    
    #Get all Activities for first hour, save to dataframe (df1) and append to empty created df
    result = api_call.json()['activityEventEntities']
    df1 = pd.DataFrame(result)
    pd.concat([df, df1])

    #Call Continuation URL as long as results get one back to get all activities through the day
    while contUrl is not None:        
        api_call_cont = requests.get(url=contUrl, headers=header)
        contUrl = api_call_cont.json()['continuationUri']
        result = api_call_cont.json()['activityEventEntities']
        df2 = pd.DataFrame(result)
        df = pd.concat([df, df2])
    
    #Set ID as Index of df
    df = df.set_index('Id')

    #Save df as CSV
    df.to_csv(path + activityDate + '.csv')

Let’s test our script by executing it. Once finished I see that a CSV file is stored in my ADL Gen2 – awesome! Now I can automate it in Azure Synapse through a Azure Data Factory Pipeline and run it on a daily base. After a while I see multiple files, one for each day.
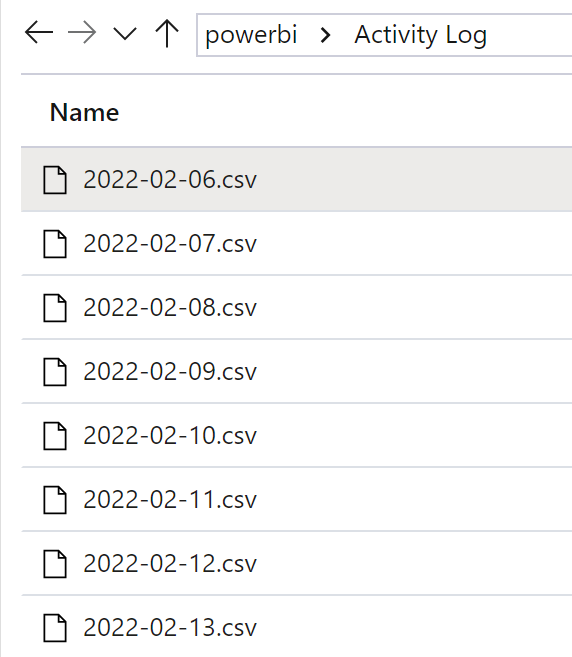
Let’s quickly test the result by querying the CSV files through Serverless SQL built-in Azure Synapse (yes, that’s possible!)

Great, we have some data with different Activities!

In my next post I’ll walk you through how to create a Power BI Report on top to analyze the different log files at once – stay tuned!

Please let me know if this post was helpful and give me some feedback. Also feel free to contact me if you have any questions.

If you’re interested in the files used in this blog check out my GitHub repo https://github.com/PBI-Guy/blog

Multilingual Reports in Power BI

Creating Power BI reports in Switzerland can be challenging when it comes to the question: In which language should we display the report? The reason behind is that Switzerland has 4 official languages and if we consider English, it’s even 5. Therefore it’s not easy to fulfill this requirement with one report – or is it? Let me walk you through different scenarios how you can create multilingual reports with Power BI.

Possible Solutions

As in most scenarios in Power BI there are different ways to achieve the same goal. Therefore let me list some solutions:

  • Create a separate report for each language
  • Create one report and translate data through a service (like Azure Cognitive Services)
  • Create a Datasets for each language
  • Create a report, use a “translation table”, and work with bookmarks
  • Create one report and a “translation table” to display the right language

Of course each scenario has his pros and cons so let me go through some of them quickly and focus afterwards on the main solutions I’m going to present in this post.

Create a separate report for each language

Creating a separate report for each language is from my point of view a maintenance nightmare. Imagine having 5 different languages, therefore having 5 “different” reports (which all look the same but using only a different language), and now you have to customize a visual. Not only you have to do the work multiple times, you have to do it every time a modification is required! Besides that you have to keep an overview which users has access to which report making sure they have access to the right language. Therefore I wouldn’t recommend to go this path and look into other ways to fulfill the multilingual report requirement.

Create one report and translate data through a service

Using a Service to translate your data is a nice and handy solution. The good side of this approach is that you do not have to create your own translation for each word and sentence for each language. This can be done automatically through an API. On the other hand the translation itself could lead to unexpected results, sentences could be translated in a wrong or misleading way which can cause other, unexpected issues which could be avoided in the first place. Therefore it’s not a perfect solution but for sure one worth trying if you do not have a “translation table” which can be used. If you’re interested in how to call an API to translate your data let me know and I’ll be happy to post about it in future.

Create a Datasets for each language

Chris Webb wrote a great article (see https://blog.crossjoin.co.uk/2021/02/21/implementing-data-as-well-as-metadata-translations-in-power-bi) how you can create multiple Datasets – one for each language – and use the DirectQuery Mode (not Live Connection! 😉 ) to connect to the needed Dataset. This approach has also his benefits as the data and meta data like column name and title can be translated. On the other hand it’s again a maintenance effort for all the different Datasets and PBIX files.

Create a report, use a “translation table”, and work with bookmarks

I saw a post from Greg Philips how you can handle Multilingual Reports with a translation table and multiple pages and bookmarks. Everything is described here: https://blog.enterprisedna.co/create-a-multilingual-power-bi-report/

This solution gives you the full flexibility to translate data, columns, titles, etc. in your report. On the other hand you would need to create a separate page for each language and maintain the bookmarks on top of it. If changes will occur you would need to change it on every page. Still better than having multiple reports, but could lead to a lot of maintenance hours. Nevertheless it’s a really nice solution to work with different languages in one report.

Create one report and a “translation table” to display the right language

Another approach is to have a “translation table” within Power BI which is used to translate the needed data in the right language. Let me walk you through how this could look like in Power BI.

As an example imagine we have a table with some fruits, numbers, and an ID for each fruit. Further we have a second table with the fruit ID, display language, and the translated value.

Once in Power BI imported you can create a relationship between the two tables through the ID if that’s not already automatically done during the import process.

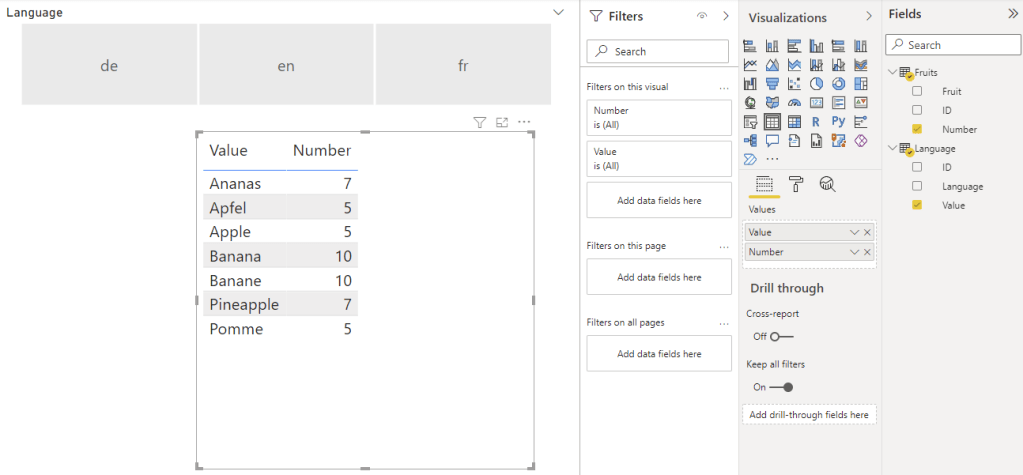
As a next step you can add a Slicer Visual using the Language column from the Language table and add a Table Visual with the Number Column from the Fruits table and Value Column from the Language table.

If you select now a language in the slicer the Table Visual will filter it to the selected language. You can even force a selection through the slicer in the settings by turning on “Single select”.

To enhance this solution and apply automatically the correct language you can even build a third table matching the language with an user and use RLS to apply the right language. In my simple solution I created following table.

Tip: I blogged about RLS a while ago and if you’re interested in how to implement it check it out here: https://pbi-guy.com/tag/row-level-security/

As you can see the table contains the language, name and UPN of each user. Once in Power BI imported create a relationship between the language column from the User Language table and the Language column from the Language table. Our whole relationship model looks now as following.

Our next step is to create a role and set a rule so users can only see their specific language. We’re going to user the USERPRINCIPALNAME() to identify which user is logged in and match the mail address with the User Language table.

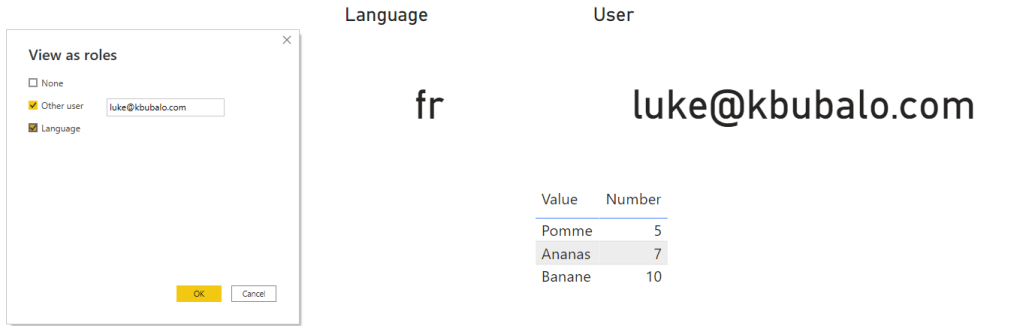
Once this is set up the Slicer Visual is not needed anymore as through RLS the data is already filtered. I just added a card visual showing the current language and the USERPRINCIPALNAME (I created a DAX measure for this). If we test now RLS on behalf of another user – let’s take Luke – we see following.

If we change it to Chewbacca the language will apply automatically.

This approach is very good if you do not have a lot of data and languages. As you can imagine if you add a new fruit your language table will need three more lines for the three languages in this case. If you add a new language your language table will increase even more which leads to a bigger data model size in both cases. Further performance can decrease due to the implemented RLS rule. On the other side user experience can increase as the language will automatically apply but users can’t change it on their own if RLS is in place (e.g. in my personal case I prefer to display everything in English even if I’m based in the German-speaking part of Switzerland).

Besides data translation Power BI offers ways to translate field and table names automatically as well. Let me show you how to add different languages into your model.

Translate Power BI field and table names

To be able to add multiple languages into your model you’ll need to work with third-party tools. This could be Visual Studio, Tabular Editor, or anything else that can handle and configure a tabular model. In my case I like to work with Tabular Editor because as soon as you install it you’ll have it integrated in Power BI Desktop to open it directly from the ribbon connected to your model.

Once opened you’ll find a “Translations” folder in your model. Right-click on it and hit New Translation.

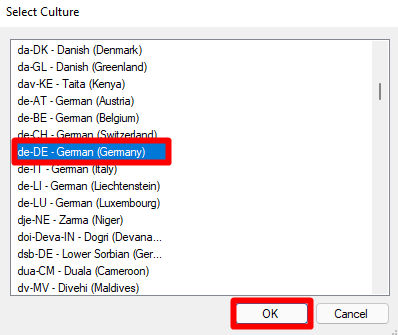
A new window will pop-up where you can choose which culture you wish to add. In my case I select de-DE and hit OK. This means once translations are implemented in de-DE language Power BI will recognize the Browser or Power BI Desktop Language Settings and display automatically the translation of my tables and columns in this language.

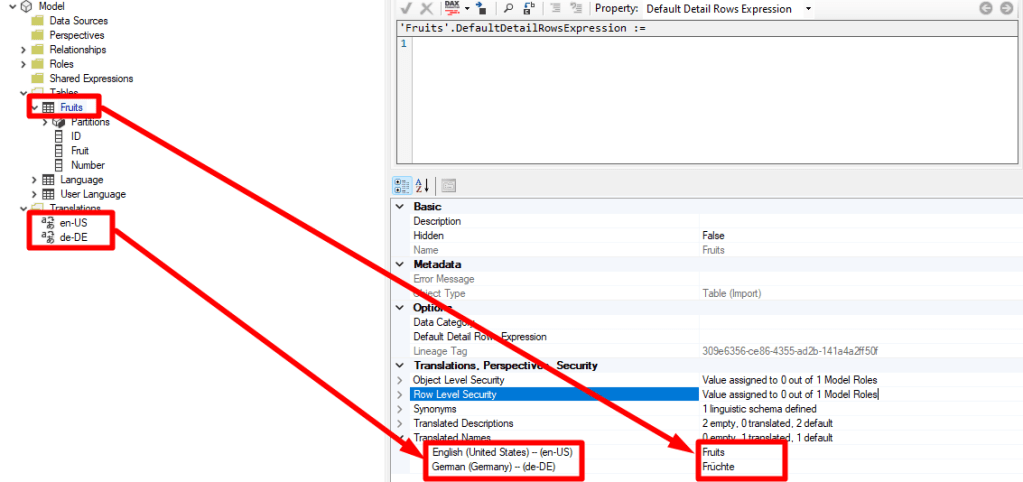
You’ll notice how the Translation folder has now two different languages. In my case en-US and de-DE. Now I can expand the Tables folder, select a table or column, scroll down to Translated Names Properties and add for each language a translation. As you can see in my example below I choose the table Fruits and translated it to Früchte in German.

To make the translation easier Chris Webb has a very useful and easy-to-use tool which is available for free here: https://www.sqlbi.com/tools/ssas-tabular-translator. To be able to use it export the translations as json file and import it afterwards by right-clicking on the Translations folder in your model.

Once everything is translated as wished save your model and publish the report to Power BI Service. In there you have to change the browser language or choose through Power BI settings your preferred language and your table and column names will be display accordingly. If you wish to test in in Power BI Desktop keep in mind that since March 2021 release Power BI Desktop will not reflect the model translations so you would need to have an earlier version if you wish to do so.

Edit: Further keep in mind that this works only with Premium. Therefore you’ll need Power BI Premium, Premium per User, or an Embedded capacity.

Please let me know if this post was helpful and give me some feedback. Also feel free to contact me if you have any questions.

If you’re interested in the files used in this blog check out my GitHub repo https://github.com/PBI-Guy/blog
Refresh a Power BI Dataset with Python

As you probably know Power BI Datasets can be refreshed manually, on a scheduled base or through the Power BI REST API. Depending on the data source you will require a Power BI Gateway to be able to update your dataset. Manually refreshing a dataset can be handy if you need an instant refresh but usually you will at least schedule it to automate this process. But in few scenarios you probably don’t want to wait till a certain, scheduled time or you wish to trigger a refresh immediately but programmatically after your ETL / ELT process has finished. In this blog post I’m going to show how to trigger a refresh with Python.

JFYI: You can also use Power Automate, PowerShell or anything else that can call and authenticate against the Power BI REST API to trigger a dataset refresh and there are plenty good blog posts out there explaining how to do so.

Prerequisites

  • Power BI Dataset in Power BI Service
  • basic Python know-how
  • a registered Azure App
  • optional: Azure Synapse Analytics

How to

First of all we need a Service Principal on which behalf we can trigger the Dataset refresh programmatically. You could also use your user and password to log in and call the Power BI REST API (so-called Master User Authentication) but I wouldn’t recommend this approach due to some obvious reasons: Your password can change, what happens to the program if you leave the company, probably too much rights, etc. Therefore we’re going to register an App and give just the needed permissions. A very well how-to-guide can be found here: https://www.sqlshack.com/how-to-access-power-bi-rest-apis-programmatically/.

Checking the doc (https://docs.microsoft.com/en-us/rest/api/power-bi/datasets/get-refresh-history-in-group & https://docs.microsoft.com/en-us/rest/api/power-bi/datasets/get-refresh-history-in-group) we see that in our case we need at least the Dataset.ReadWrite.All or Dataset.Read.All to be able to check the Refresh History, and Dataset.ReadWrite.All to be able to trigger a refresh.

Before we’re going to refresh a Dataset we want to make sure that no refresh is happening right now. That’s the reason why we need the Refresh History API.

Once the app is register you’ll get an App ID and Secret. Store this information somewhere securely as we’re going to need it later on.

To be able to access the Dataset our Service Principal will need sufficient permission on the dataset itself. In my case I’m just going to add the user as admin in my workspace.

As a next step we’re going to write our Python Code, authenticate against Power BI and call the needed REST APIs. You can choose whatever environment suits you best to write Python. In my case I’m going to use Azure Synapse and create a Jupyter Notebook to run my Python Code.

If you’re interested in how to start with Azure Synapse feel free to check out this link: https://docs.microsoft.com/en-us/azure/synapse-analytics/get-started

I created a folder called PBI Guy and create a new Notebook with the name Power BI Dataset Refresh.

As first step we need to have some code and assign afterwards a Spark Pool to be able to run it. I like to start with importing my needed libraries. Because we need to authenticate against Microsoft Azure Active Directory we’re going to use the MSAL library (https://docs.microsoft.com/en-us/azure/active-directory/develop/msal-overview). Further we will call the Power BI REST API. For this purpose I’m going to use the requests library (https://docs.python-requests.org/en/latest/). Afterwards we would need to convert the output into a JSON format to make it easier to process the data. Therefore we’re importing the JSON library as well (https://docs.python.org/3/library/json.html). Last but not least I’m going to use the Pandas library (https://pandas.pydata.org/) just because it’s so simple to transform and extract the necessary data. Luckily with Python importing libraries is straight forward and our first code snippet looks as following.

I’m sure there are multiple, probably easier ways to achieve the same goal triggering a Power BI Dataset refresh but thinking about future improvements of my code (probably store the refresh history, compare it to other data, etc.) I’ll make it nice and clean from the beginning.

Our next goal is to set up all the needed parameters – and there are a few! We will need:

  • Client ID
  • Client Secret
  • Tenant Name
  • Workspace ID
  • Dataset ID

After we registered our App / Service Principal we got the Client ID and Secret. If you’re not sure what’s your tenant name just login to your M365 Admin Center, go to Setup, click on Domains, and see your domain name ending – this is your M365 tenant name. The easiest way to get your Workspace and Dataset ID is to head over to Power BI Service, click on your Dataset and check your URL. The red part is the Workspace ID, the blue part shows you the Dataset ID.

Besides that we specify the Authority URL which is needed to authenticate with the MSAL library. Basically it points Python to the right Microsoft Tenant. Further we also need to specify the scope (Power BI in this case). Lastly we also need our Power BI REST API URL. Because we’re interested just in the last refresh history status we filter it in the query to Top 1. With all these information we create following code snippet.

Now it’s time to authenticate and grab an access token which can be used to call the Power BI REST API and get the Refresh History of the Dataset. Once authenticated and an access token is available, we’re using it to provide it to our header of our request statement. After we set up the header correctly we call the API through a GET request providing the URL from above and the header we just created including the access token. As a next step we’re converting the result directly into a JSON format which is used to format it again to a Pandas Dataframe with the columns requestId, id, refreshType, startTime, endTime, status. All these information are provided through the Power BI REST API. Lastly we set the Dataframe Index as the id column. Our code should look now as following.

Let us know check if the code runs successfully. We’re going to execute the whole code to import all libraries, set the parameters, authenticate, and call the Power BI REST API to get the refresh history of our dataset. If everything works fine we should see a result like the one below.

Perfect, this means we got now the Power BI Dataset refresh history and see the last refresh has been executed on demand (meaning manually) and it’s completed. The status in our case is very important because if the refresh is running we can’t trigger a new one and it will fail. From the documentation we can see there are four different status:

StatusDescription
UnknownState is unknown or refresh is in progress
CompletedRefresh completed successfully
FailedRefresh was unsuccessful
DisabledRefresh is disabled by a selective refresh

So to trigger our refresh we want to make sure the status is not unknown. Further we can also specify what should happen if the last refresh status is failed or disabled (e.g. enable it through another API – see https://docs.microsoft.com/en-us/rest/api/power-bi/datasets/update-refresh-schedule-in-group). Due to demo purpose I’m just going to print out a different message based on the status. This means our last code snippet checks the status and depending on it executes a different code.

I added an else section as well if for some reason a new status code will appear so I’m handling every situation separately.

If we now execute the last bit of our code we see the right message has been printed out – so far so good.

But let’s also check the Power BI Dataset Refresh History. If we switch now to Power BI Service, select our Dataset, move on to Settings and check the Refresh History we see following – our Dataset has been refreshed and triggered via API!

Imagine what you can do now – not only calling the Dataset Refresh REST API but as well any other API Power BI offers via Python! Because I’m in Azure Synapse I can even integrate my Python script in Azure Data Factory and trigger a refresh at the end of my ETL / ELT pipeline, and many more! I’m really excited about this opportunity and will definitely elaborate more possibilities in near future.

Keep in mind that the limitation of your licensing can’t be eliminated. This means if you’re using the Power BI Free license you can programmatically refresh a dataset once a day. With a Pro License it’s eight times a day, and with Premium or Premium per User it’s 48 (see https://docs.microsoft.com/en-us/power-bi/connect-data/refresh-data#data-refresh).

Please let me know if this post was helpful and give me some feedback. Also feel free to contact me if you have any questions.

If you’re interested in the files used in this blog check out my GitHub repo https://github.com/PBI-Guy/blog

Power BI and Paginated Reports – beyond usual use

A lot of customers are asking me what are the differences between Power BI and Paginated Reports, why should they use one OR the other. My answer is mostly: It’s not one OR the other, why not combine and get the most out of both worlds?! I suggest in many cases that Power BI can be used as interactive dashboard “entry-tool” for end users to analyze dynamically their data. But once a pixel-perfect report should be created as PDF (it’s mostly PDF so we’re going to focus on this format) Paginated Reports are simply better. So why not creating a button within your Power BI report to take all the selected filters automatically and create out-of-the-box a Paginated Report PDF print-out? Most customers are first wondering that this kind of scenarios are possible and of course wondering how it can be done. Let me walk you through how to add such a button within a Power BI report in this blog post.

Prerequisites

  • Power BI Report
  • Paginated Report
  • Power BI Desktop
  • Power BI Report Builder (recommended)
  • Power BI Premium / Power BI Premium per User / Power BI Embedded
  • Basic understanding of both worlds

I already have a Power BI and a Paginated Report ready to combine it. If you’re not familiar how to create a Paginated Report or from where to get a simple demo file I can highly recommend the Power BI Paginated Reports in a Day Course. In this course you’ll learn the differences between Power BI and Paginated Reports, how to start and build your first report, and how to publish it afterwards to Power BI.

Further Paginated Reports are only supported with Premium. Therefore you will need a Power BI Premium capacity, Premium per Use license, or Power BI Embedded.

How to

The very first thing we need to do is to publish our Paginated Report to Power BI to get the unique ID of the report from the Service. In my case I open the RDL file with Power BI Report Builder and publish it to a workspace backed up with a PPU license. I name it Sales Analysis.

Once done the report will be available in Power BI Service. If we open it we’ll see the URL pointing to our specific workspace with a unique ID (1a8b6910-c4a2-4611-ae75-5d0b968eb6d3) and pointing to our Sales Analysis Paginated Report which has as well a unique ID (66a1a70a-89cf-4d48-80c1-39d766f9892b). This means we can use this URL to get to our just published Paginated Report.

If we check the Microsoft Documentation about Power BI and how the URL is build (see https://docs.microsoft.com/en-us/power-bi/paginated-reports/report-builder-url-parameters) we see that the URL can be enhanced to provide values for parameters, to provide commands to get a specific format, and many more. So before building something in our Power BI report let’s try the URL to understand what’s possible.

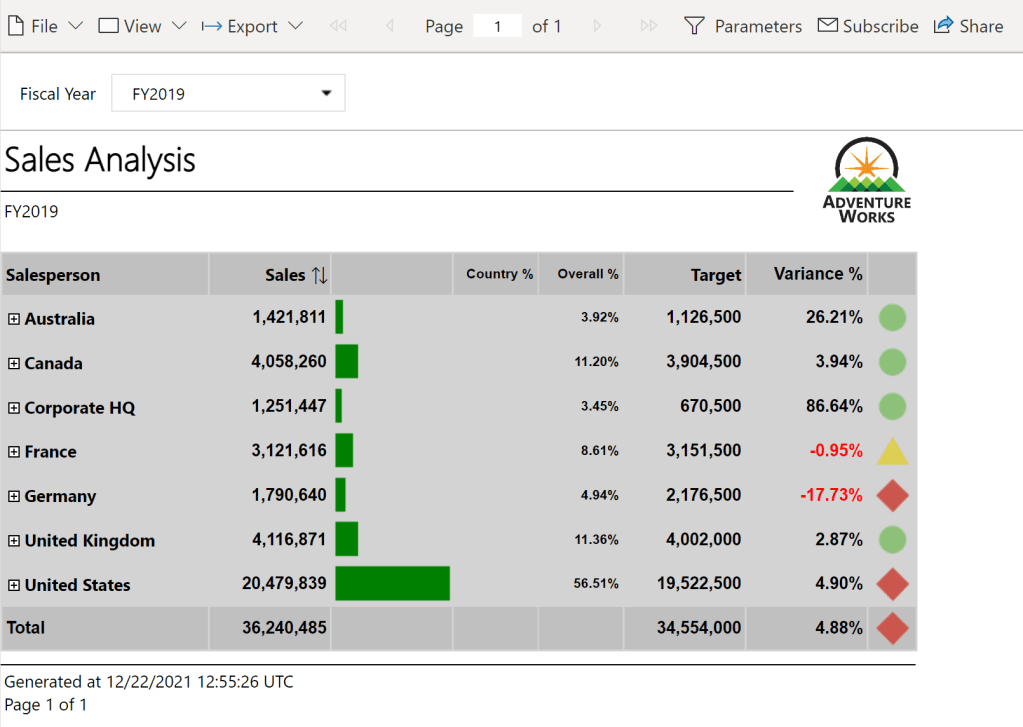
Let’s first try to give a value to the parameter. To initialize a parameter we have to add “?rp:parametername=value”. In our case the internal parameter name of the Paginated Report is called DateFiscalYear and can be checked in Power BI Report Builder. Checking the properties we also see that the parameter is a data type text.

If we’re looking for possible values we can check the “Available Values” and see if a query is used or something is hardcoded within the parameter settings. Alternatively we can also open the Report in Power BI Service and check the drop down list of the Parameter. If we do so we can see that following values are expected.

Let’s try to build the URL now with what we got so far:

URL to Reporthttps://msit.powerbi.com/groups/1a8b6910-c4a2-4611-ae75-5d0b968eb6d3/rdlreports/66a1a70a-89cf-4d48-80c1-39d766f9892b
Initializing Parameter?rp:
Parameter NameDateFiscalYear
Parameter ValueFY2019
Whole URLhttps://msit.powerbi.com/groups/1a8b6910-c4a2-4611-ae75-5d0b968eb6d3/rdlreports/66a1a70a-89cf-4d48-80c1-39d766f9892b?rp:DateFiscalYear=FY2019

If we call the URL now the parameter is automatically set to FY2019 and the report is loaded.

Let’s go further and try to get a PDF automatically. To do so we only need to add “&rdl:format=PDF” at the end of our URL. The “&” symbol combines different commands and to get a PDF automatically the rdl:format=PDF is necessary. Therefore our whole URL looks now as following:

https://msit.powerbi.com/groups/1a8b6910-c4a2-4611-ae75-5d0b968eb6d3/rdlreports/66a1a70a-89cf-4d48-80c1-39d766f9892b?rp:DateFiscalYear=FY2019&rdl:format=PDF

If we call this URL Power BI will automatically generate a PDF.

So far so good! Now that we understand how the URL of a Paginated Report works and how we can modify it let’s try to implement it in our Power BI Report.

After opening the Power BI Report in Power BI Desktop we can add a simply DAX measure with our hardcoded URL to call the Paginated Report.

Paginated Report URL = “https://msit.powerbi.com/groups/1a8b6910-c4a2-4611-ae75-5d0b968eb6d3/rdlreports/66a1a70a-89cf-4d48-80c1-39d766f9892b?rp:DateFiscalYear=FY2019&rdl:format=PDF”

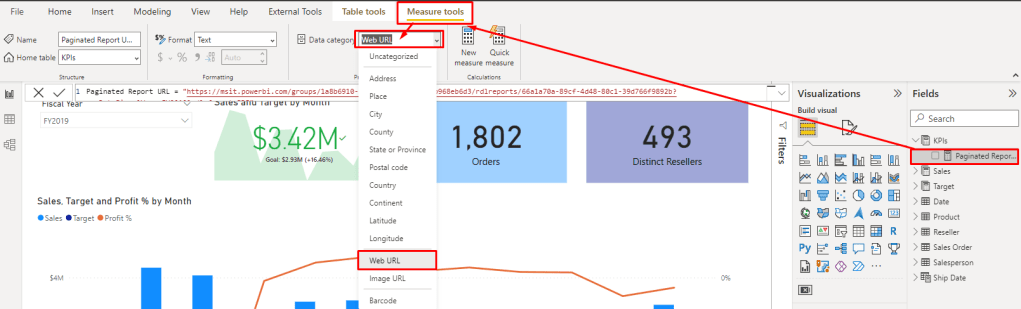
Once added make sure to mark it as Data Category Web URL.

If we add now the measure to our report we see our hardcoded URL. If we click on it the Paginated Report will open. Unfortunately it’s not “connected” with our Power BI Report so far. Meaning if I change the Slicer for example to FY2020 the URL will still point to FY2019. Let’s fix this with some DAX magic.

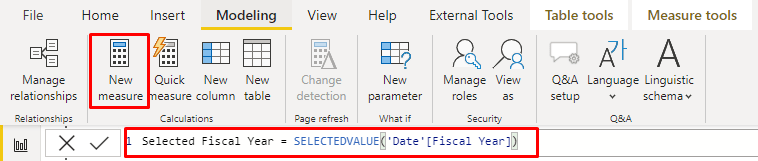
I add a new Measure to get the selected value of the slicer. In this case I use following formula:

Selected Fiscal Year = SELECTEDVALUE(‘Date'[Fiscal Year])

Now I just replace the hardcoded FY2019 from the first Measure with my second Measure. The DAX Measure looks now as following:

Paginated Report URL = “https://msit.powerbi.com/groups/1a8b6910-c4a2-4611-ae75-5d0b968eb6d3/rdlreports/66a1a70a-89cf-4d48-80c1-39d766f9892b?rp:DateFiscalYear=” & KPIs[Selected Fiscal Year] & “&rdl:format=PDF”

Now every time I select another FY my URL will automatically adopt. That’s very simple with a single selection but what if I wish to have a multi selection, will it still work? Let’s try it out. But before testing the URL we need to make sure the Slicer is enabled for Multi Selection as well as the Parameter in our Paginated Report. Therefore I change the settings of both.

Don’t forget to republish the Paginated Report once the Property has been modified.

Let’s test our URL now in Power BI if we select two FY. I added the Paginated Report URL Measure into a Table visual to see it and select two different FY. Unfortunately the URL do not show both years, even worse it just disappeared. The reason behind is that the SELECTEDVALUE function expects one value.

Luckily we can also give an alternative to the SELECTEDVALUE function in which we can concatenate multiple values. To make sure we got the each value just once we need to use the DISTINCT function as well. Our Selected Fiscal Year Measure looks now as following.

Selected Fiscal Year = SELECTEDVALUE(‘Date'[Fiscal Year], CONCATENATEX(DISTINCT(‘Date'[Fiscal Year]), ‘Date'[Fiscal Year]))

Unfortunately it combines now FY2019 and FY2020 into one string and the URL contains now FY2019FY2020 which will not work. Even if we separate the two fiscal years with a comma or something else it will still not work as Paginated Report will recognize it as one value (e.g. “FY2019, FY2020” is one value and the report will not load). Therefore we need to add for each value the parameter again like in the Documentation described (see https://docs.microsoft.com/en-us/power-bi/paginated-reports/report-builder-url-parameters#url-access-syntax). The syntax looks as following:

powerbiserviceurl?rp:parametername=value&rp:parametername=value

In our case this means we have to have rp:DateFiscalYear=FY2019&rp:DateFiscalYear=FY2020 after the question mark. Let’s adjust our Selected Fiscal Year Measure to get the right URL needed. If we closely look to the syntax we see that the Delimiter can be specified. We’re going to use this and add “&rp:DateFiscalYear=”. In this case every time two ore more values are selected the values will be separated with the right expression. Our final DAX measure looks now as following:

Selected Fiscal Year = SELECTEDVALUE(‘Date'[Fiscal Year], CONCATENATEX(DISTINCT(‘Date'[Fiscal Year]), ‘Date'[Fiscal Year], “&rp:DateFiscalYear=”))

We can also see that the URL is changing dynamically based on the FY selection. If we click now on the URL the Paginated Report will open with the two FY selected and print out a PDF automatically.

Our last step is now to create a button in our Power BI Report and publish it afterwards.

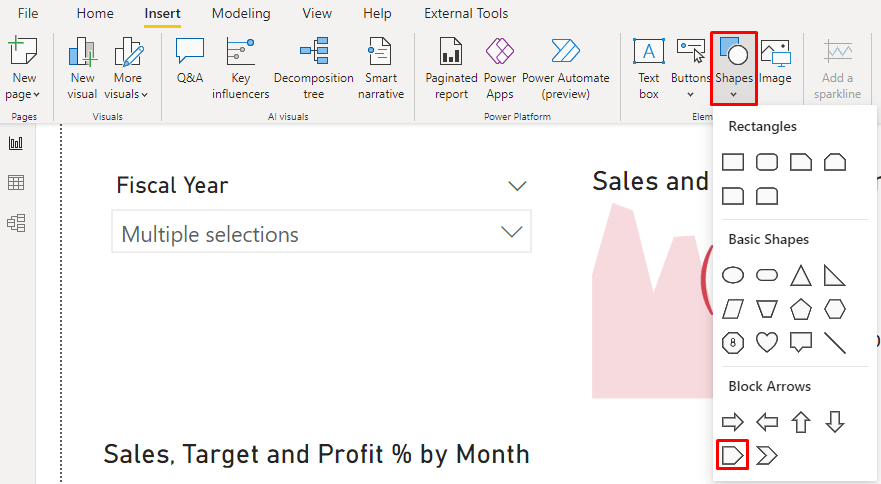
In my case I choose the Pentagon Row shape and add it into my report. Of course you can modify it as wished or even use a visual instead of a shape / button to achieve the same result (open the paginated report).

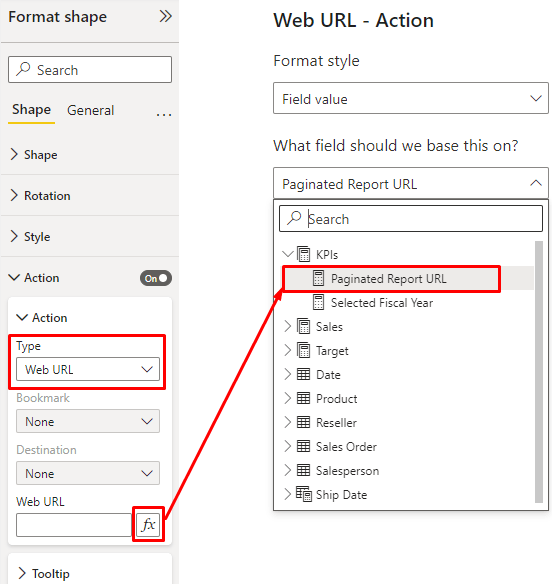
Position the shape and configure it as needed. Lastly modify the Action property, set the Type to Web URL and configure our DAX Measure to be used as Web URL.

Now just publish the Power BI Report and use the button to open the Paginated Report based on your Slicer selection in Power BI.

Conclusion

As we see we can use Power BI as entry point and use it to set filters to open a Paginated Report afterwards. Due to the flexibility of the Paginated Report URL we can also specify in which format the report should be exported. This could also be a dynamic selection in Power BI. There are further integration possibilities thanks to the Paginated Report Visual in Power BI to display a Paginated Report directly in Power BI.

Please let me know if this post was helpful and give me some feedback. Also feel free to contact me if you have any questions.

If you’re interested in the files used in this blog check out my GitHub repo https://github.com/PBI-Guy/blog

Power BI Object-Level-Security

Many users are aware that Power BI offers Row-Level-Security to secure their data. As example you can use RLS so users from a specific country can only see the sales numbers from this country and not others. I did already a blog post about the different possibilities (see https://pbi-guy.com/2021/10/12/power-bi-row-level-security/ & https://pbi-guy.com/2021/10/15/power-bi-row-level-security-organizational-hierarchy/ & https://pbi-guy.com/2021/10/15/power-bi-rls-configuration-in-service/). But many customers don’t only want to secure on a row-base they also want to secure their data on a “column-” or “table-base”. And exactly for this purpose Power BI offers Object-Level-Security. Let me walk you through how to set up OLS in Power BI.

Prerequisites

  • Power BI Desktop
  • Power BI Service Account
  • Tabular Editor

How to

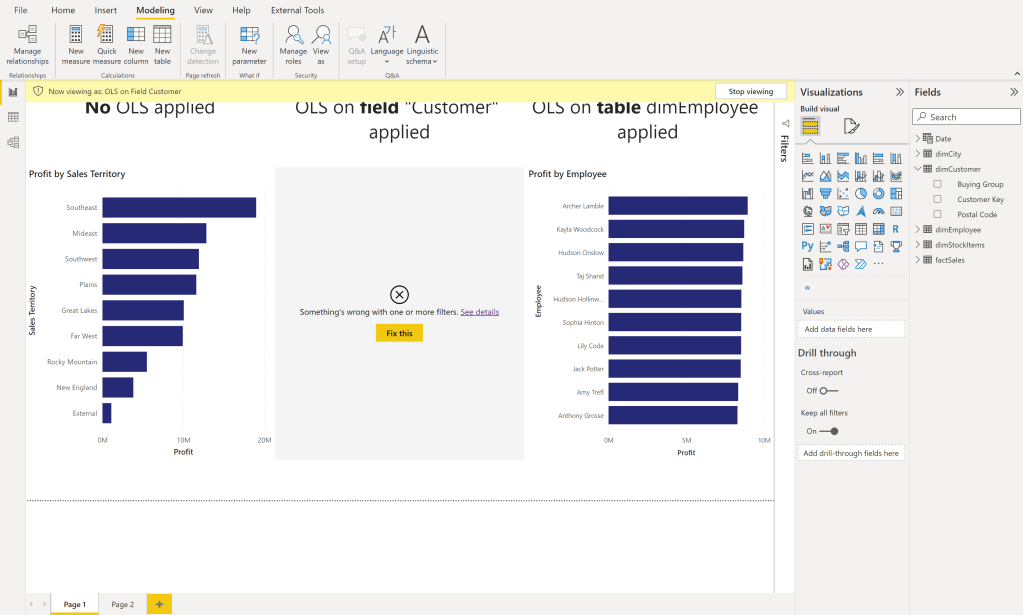
To enable OLS we start in Power BI and create first a data model. I’m going to use my standard Sales Report with Wide World Importers sample data. Further I created three visuals with Text boxes to show the different OLS options – No OLS applied, only on one specific column (customer), and on the whole table (dimEmployee). Every visual shows the Profit by different dimension. First one by Sales Territory, second one by Buying Group, and the third one by Employee.

As a next step we have to create the different Roles so OLS can be applied to it. Go to the Modeling Tab in the Ribbon and select Manage Roles.

In here I created two different roles – one where only the OLS for the column Customer should be applied and one where the whole Table dimEmployee should be secured. No DAX expression or anything else is needed – just the two empty roles. Once done hit the Save button.

After the test page and the roles are set up I connect to my model with Tabular Editor by selecting it through the ribbon External Tools.

Pro Tip: If you open Tabular Editor directly from Power BI Desktop you’ll be automatically connected to your data model.

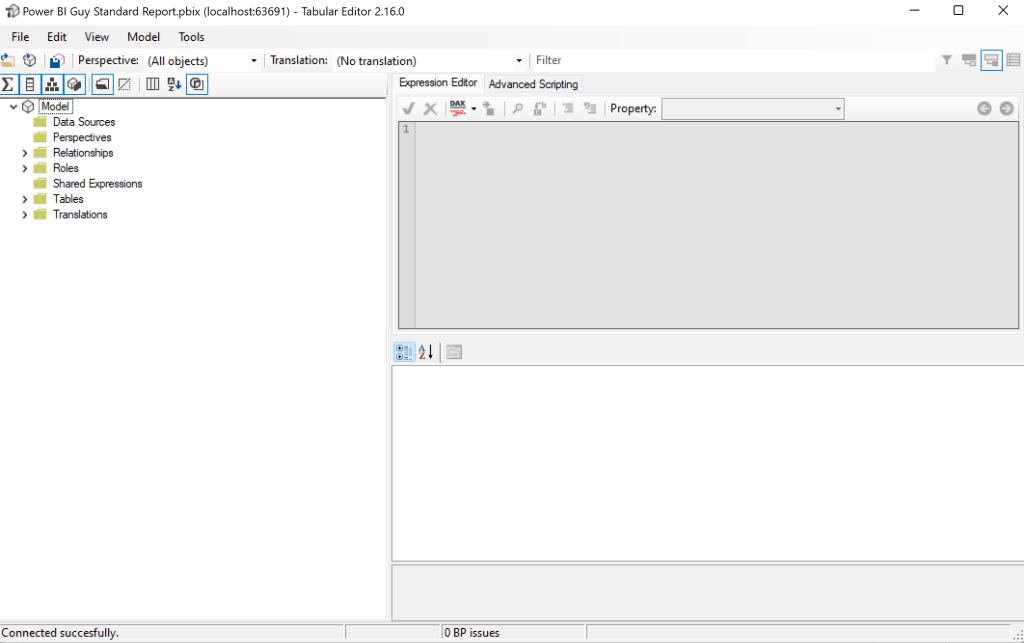
Once Tabular Editor has opened you should see a similar screen like the below.

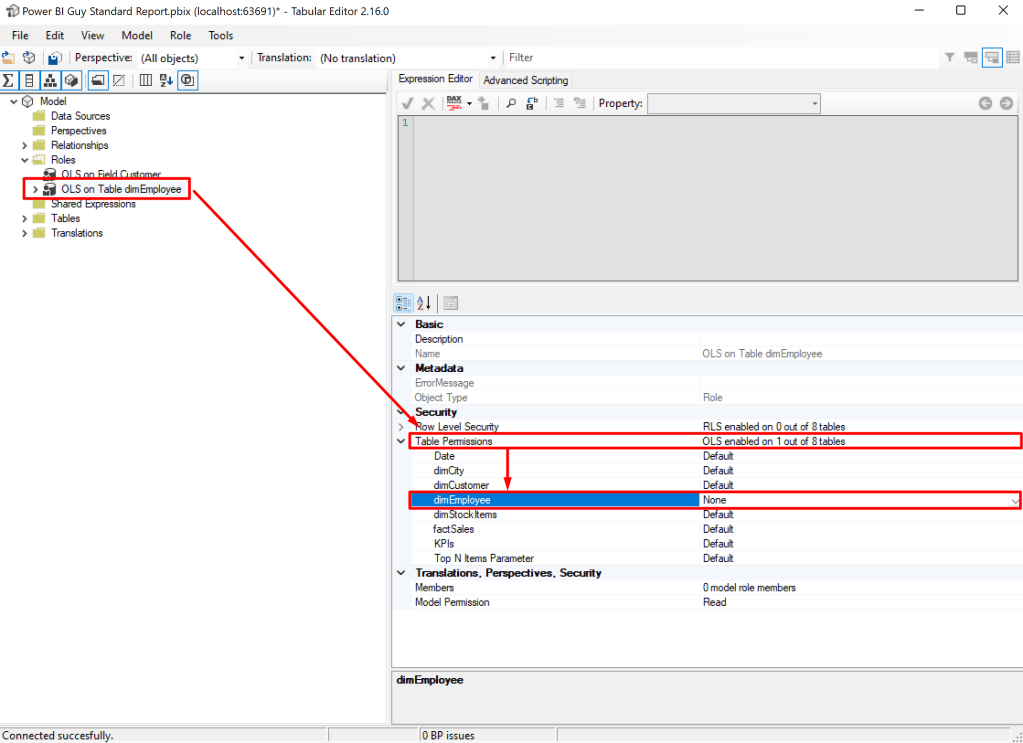
As a next step I expand the Roles and select first the “OLS on Table dimEmployee”. Once the role is selected in the property pane you see a property “Table Permissions” in the “Security” section. Expand it and configure “None” to the table which should be secured. In our case it’s dimEmployee. This means that every user who will be added to the “OLS on Table dimEmployee” role afterwards will not see any data coming from the dimEmployee table.

Now I select the other role and instead of “None” I set the dimCustomer Table to “Read”. The reason is we just want to secure one specific column and not the whole table. Therefore the table can be read in general but we have to configure specific columns which should be secured. After you set the dimCustomer table to read the role can be expanded on the left hand side which lists all tables in “Read” or “None” mode.

Next select the dimTable below the role, head over to “OLS Column Permissions” under “Security” in the property pane and set the column “Customer” to “None”. Every other column will use the Default behavior of the table which is “Read”.

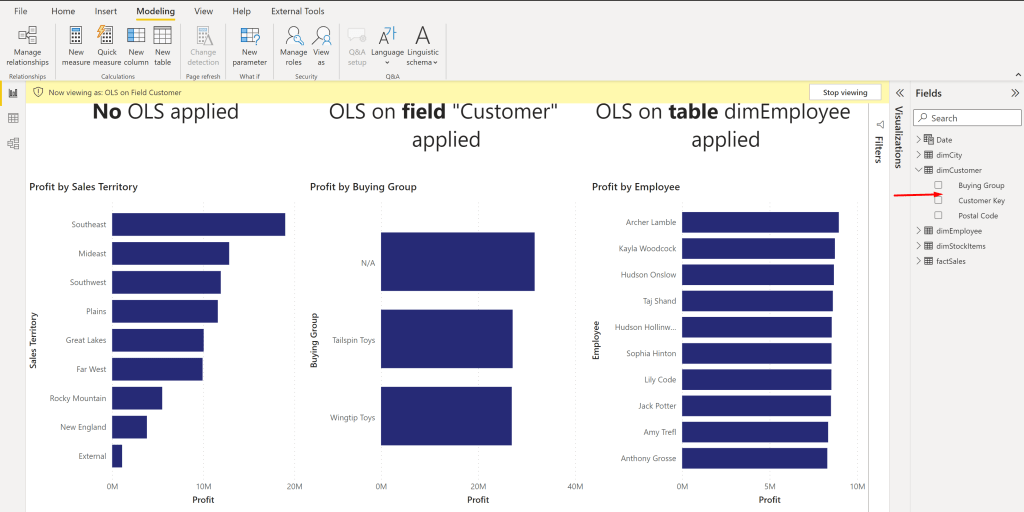
After we set up everything now in Tabular Editor we can save our model and close Tabular Editor. Back in Power BI Desktop let’s test our roles. First I test the “OLS on Table dimEmployee” role by going to Modeling – View as – selecting OLS on Table dimEmployee – and hit OK.

We see that our OLS works because the right hand visual is not showing anything. Further the whole table dimCustomer is also not visible.

That’s exactly what we expected – great! Let’s test the second role. After we switched the view every visual is showing up but the “Customer” field in the table “dimCustomer” is hidden. This is also expected as we’re not using the Customer field in our report so far therefore everything can be shown.

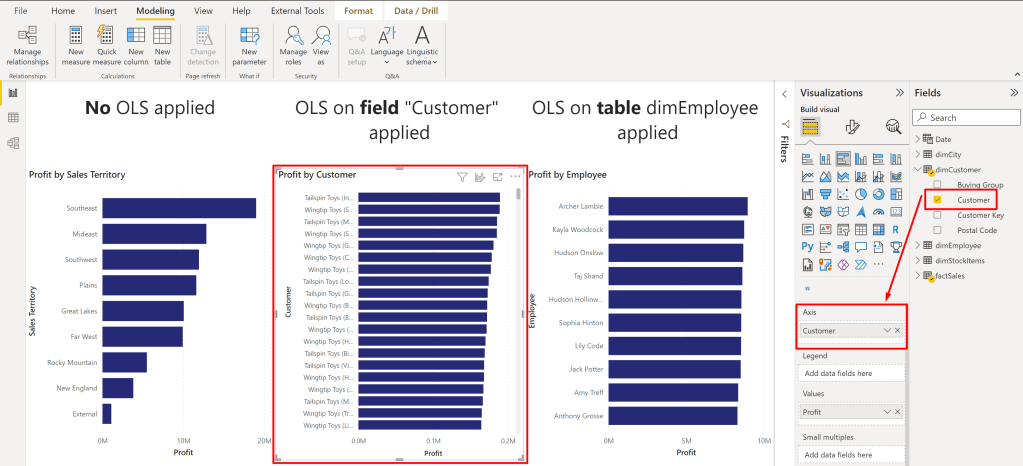
Let’s turn of the role view and replace the “Buying Group” column with “Customer”.

Than we enable the role view again to see if security applies.

And as we can see yes it does! Because the visual is using the column Customer now it’s not showing up.

As a last step you would need to publish the report to the Service and assign user / groups to the desired role. One user / group can also be added to multiple roles if needed like with RLS.

Personally, I find the OLS very useful to secure your data model but the message which appears to end user is not very user friendly. I would love to see an update here which says at least it’s secured instead of “Something went wrong” because as an admin it’s expected behavior and not wrong. Best option would be if I could configure the message as I wish.

Please let me know if this post was helpful and give me some feedback. Also feel free to contact me if you have any questions.

If you’re interested in the files used in this blog check out my GitHub repo https://github.com/PBI-Guy/blog

Show “secured” Images in Power BI

Use Case

From time to time I got asked how you can display images in Power BI. The answer is pretty simple and straight forward (see https://docs.microsoft.com/en-us/power-bi/create-reports/power-bi-images-tables) if the image is publicly available. But customers can’t expose their internal pictures to the public and still want to display them in Power BI. The issue is with “secured” images that the Power BI visual can’t log in with an account to be able to display it. So how can you still save your images in a secured environment and still display them in Power BI? Let’s check it out.

I tried different ways and found two that work. One would be to get the binaries of each image, transform it to a text field and display afterwards with a custom visual the image. This solution has a big “but” from my point of view. Because the text field has a 32766 character limit you would either have to resize your image or you have to do some Power Query and DAX magic to split the field into multiple ones and add them afterwards together again. Chris Webb wrote a blog how this could be done here: https://blog.crossjoin.co.uk/2019/05/19/storing-large-images-in-power-bi-datasets/

As good as this solution might be I would like to find an easy, low-code / no-code way to achieve the same. And luckily there is one!

Power Apps & Power BI – Better Together

Because Power BI is part of the Power Platform and Microsoft offers a seamless integration into the other Services (and vice versa) let’s leverage the benefits of it and try to display our images through a Power Apps app in Power BI.

Prerequisites

To be able to implement the solution you would need a few things:

  • Power BI Desktop
  • Power BI Service Account (optionally)
  • Power Apps Account
  • SharePoint Document Library with pictures

The Power BI Desktop can be downloaded for free through the Power BI website. Power Apps is included in different licensing options like E3 or E5. In our case we’re going to use a SharePoint Connector which is a Standard Power Apps connector meaning no additional licensing is needed. If you don’t have a Power Apps license yet you can sign up for a Developer Plan and use to for development purpose. Keep in mind that you can’t share your apps created with a Dev. Plan nor can you show Power Apps apps in Power BI coming from this specific environment.

How to

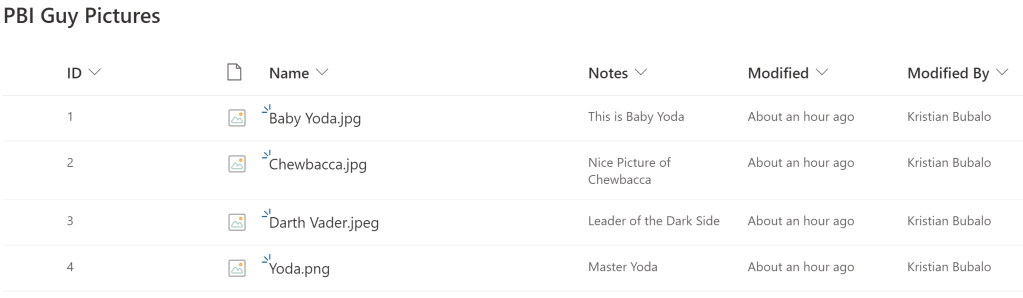
We start in Power BI Desktop and connect to our SharePoint list to get a few basic details. I’ll not guide you through how to connect to a SharePoint Document Library. These details can be found here. In my case I have a simple Document Library with some Star Wars picture.

In Power BI I connect to the Document Library and get only the ID, Notes, Created, Modified, and ServerRelativeURL fields. You can of course select more or less fields but make sure you get the ID which will be needed later on in the Power Apps app.

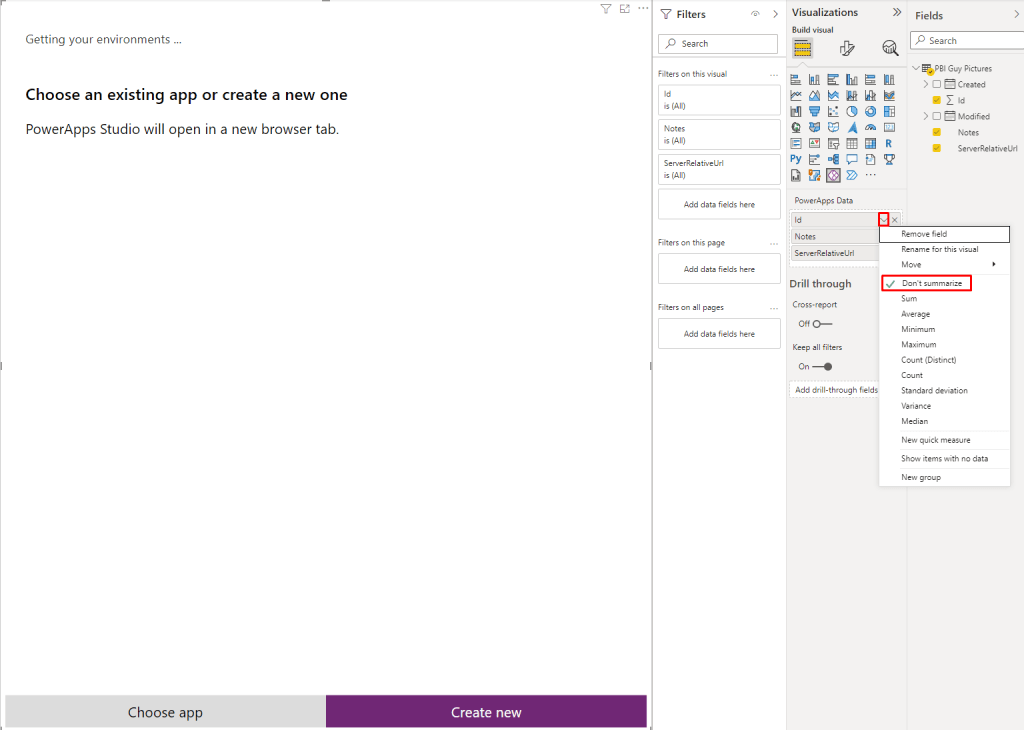
Once loaded I create a simple Table visual with the three fields ID, Notes, and ServerRelativeURL to display some data. As a next step I add the Power Apps Visual to my canvas and position it to the right. Once you added the Power Apps Visual you’ll see the necessary steps how to get started.

So let’s do our first step and add our wished fields to the data section of the visual. This fields can be accessed later on through Power Apps. Make sure to add the Id field and also check that it doesn’t summarize! The behavior (Sum, Count, etc.) will be provided to Power Apps and we don’t want to summarize our Ids. As soon as you add your first field the Power Apps visual will change where you can choose and existing app or create a new one. In our case we’re going to create a new one. A window will pop up asking if it’s ok to open your browser with the Power Apps URL. Hit OK.

Tip: If you’re facing some issues while opening Power Apps or you can’t choose your environment through the Visual, open Power Apps in your default browser, choose your environment in the browser, switch back to Power BI and try to hit the “Create New” button again.

Once Power Apps is loaded you’ll see an object call “PowerBIIntegration” (besides some others). This object has been automatically created through Power BI and makes sure that Power BI and Power Apps can interact with each other. This means for example if you select now a specific image to filter the same filter will also apply in Power Apps. That’s the reason why you have to start from Power BI and create an App from there. Otherwise the “PowerBIIntegration” object will not be created.

Let’s quickly test if the integration really works. I select the Baby Yoda picture in Power BI and the list is automatically filtered in Power Apps – great!

Our next goal is now to show the Images from SharePoint in our Power Apps app and make sure the integration still works (filter on a specific image in Power BI should also filter the Image in our app). Therefore we first have to create a connection to our SharePoint list. To do so go to the Data Tab in Power Apps and add SharePoint as data source.

If you haven’t created a connection yet hit the “Add a connection” button. In my case I can choose an existing one.

Afterwards choose your Site and Document Library in which you stored your pictures. In my case I have a Doc Library called PBI Guy Pictures. I select it and hit “Connect”.

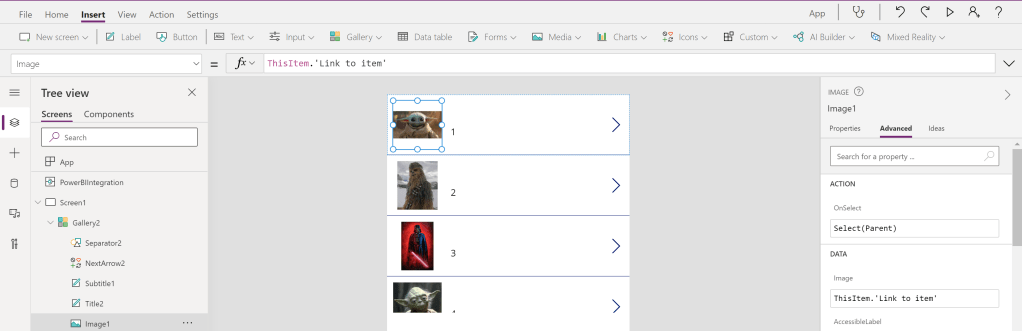
Now that we’re connected to our Doc Library we can display the images out of it. To do so insert a Gallery. I choose a vertical one but the layout can be modified afterwards as well.

Once inserted I adjust the two Galleries so that our freshly inserted one is at the top and at the bottom I display the first Gallery. Per default our new Gallery shows default text and images. We have to connect our Gallery to our SharePoint Doc Library and than decide what we wish to display. So let’s connect it by selecting the Gallery and set the Data source through the Properties pane.

Our next step is to display the right image. Select the first image object in the Gallery and choose the “Items” property either on top left of the screen or find it in the properties pane in the Advanced section.

Replace “SampleImage” with ThisItem.’Link to item’ to create the link to our needed image.

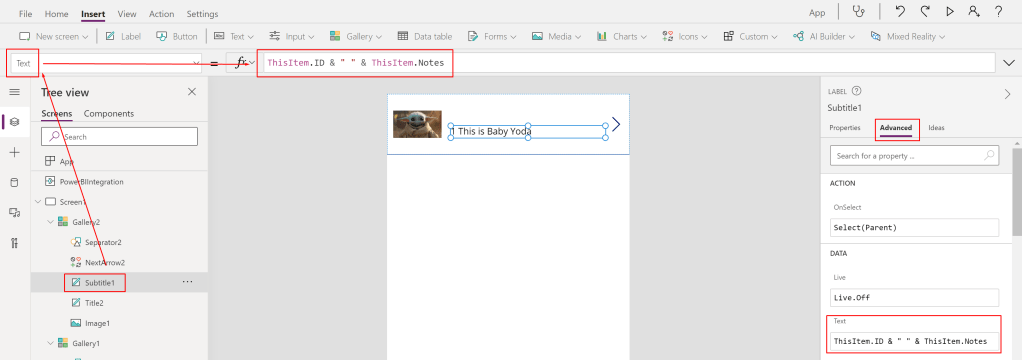
You can also modify the view of the Gallery, add new fields into it, etc. but in my case I just want to display my notes with the ID together. Therefore I select the ID Text Box and change the code in the function window from ThisItem.ID to ThisItem.ID & ” ” & ThisItem.Notes

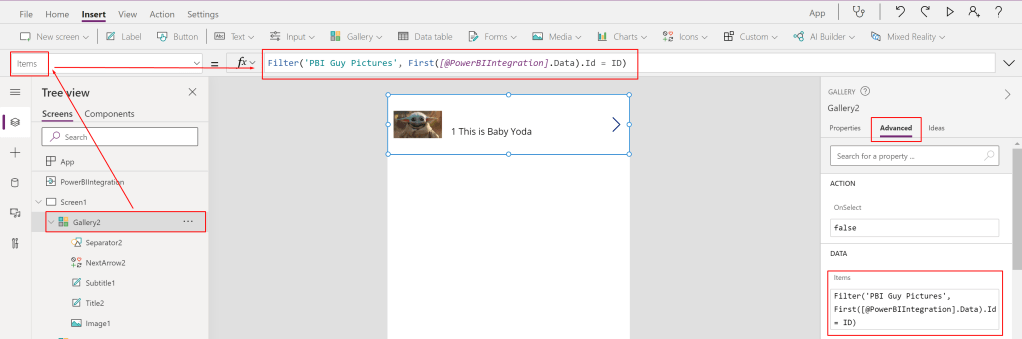
Our last step is to create a connection between our SharePoint Gallery and the “Power BI Gallery” from the beginning so that filters from Power BI will effect our SharePoint Gallery as well. The best way to do so is to filter the new Gallery by an ID to make sure we got that one specific image we’re looking for. That’s the reason why we need our ID field from the beginning! 🙂

To filter the new Gallery select it and choose the Items property. In my case I see ‘PBI Guy Pictures’. This is the whole table we have to filter and making sure that only the selected ID is showing up. Therefore we wrap our Table with a Filter() statement. Our first argument in the filter statement is the ‘PBI Guy Pictures’ table. Our second argument is the filter condition which should point the ID field from Power BI to the ID field of SharePoint. Therefore we use the PowerBIIntegration object to grab the necessary data. Unfortunately this is a Table Data Type and we can’t match Table with a single Number Data Type. To get a single value I extract just the first value of the whole table with the First() statement followed with the column I’m looking for (ID in this case). Our whole function looks now as following: Filter(‘PBI Guy Pictures’, First([@PowerBIIntegration].Data).Id = ID) And I immediately see that it works! Previously I selected Baby Yoda and now only this picture is showing up.

As a last step I want to make sure the first Gallery is not visible in my app. So I select the first Gallery and set the Visible property to false.

Of course you can now modify your app and make it more shiny but just for the demo purpose I save it as it is now through File, Save. Once done the App is ready to be used in Power BI as well and the cross-filter works!

If you wish to share the report make sure all users have also access to the Power Apps app and the SharePoint Library. Otherwise people won’t be able to see the pictures in their report.

Please let me know if this post was helpful and give me some feedback. Also feel free to contact me if you have any questions.

If you’re interested in the files used in this blog check out my GitHub repo https://github.com/PBI-Guy/blog

Power BI Theme with Background Image

A few weeks ago I saw a small but very useful hack if you’re working with Power BI Themes. Did you know that you can create a Theme with a background image? Let me show you how!

What is a Theme in Power BI?

Power BI Report Themes helps you to apply design changes to your entire report. With a Theme you can specify what the default color of your visuals should be, changing icon sets, or applying default visual formatting like title text size. Further details can be found here: https://docs.microsoft.com/en-us/power-bi/create-reports/desktop-report-themes

Once a Theme is created you can save it as JSON file and distributed it to your whole organization. Like with every other JSON file you can of course modify it as wished. In our case we wish to add a background image because background images are not saved through the Desktop in the JSON file.

How to create a Theme

Once Power BI Desktop is opened select the View Tab, expand Themes, and hit Customize current theme.

A new window will pop up in which you can customize your current Theme. In my case I choose to go with darker colors in general. You can also customize your Text, Visuals, Page, and Filter pane. Once done hit the Apply button.

You’ll see now that the current Theme is used in your Power BI report. Last step is to save the current Theme as JSON.

If you wish you can try to add a background image in your report but this will not be saved in the Theme / JSON file.

Once saved I open the JSON file in Notepad++ and format it as JSON format through the JSTool plugin. As we can see the data colors has been saved in our JSON file (and nothing else).

To be able to add now a background image we need to add a code snippet and convert our background image to base64 format. Let me walk you through the steps. First, we add following code snippet after the dataColors line.

,”visualStyles”: {“page”: {“*”: {“background”: [{“image”: {“name”: “Demo”,”scaling”: “Fit”,”url”: “data:image/jpg;base64, ” },”transparency”: 50}]}}}

Now we can add our base64 formatted image after the comma of base64 but it has to be before the quote. To convert an image into base64 just search for an online service which can do so. In my case I’m using https://onlinejpgtools.com/convert-jpg-to-base64 and simply drag my image in the necessary field. Once done you’ll get the code right away on the right sight. Hit the “Copy to clipboard” button to have it in your clipboard.

The last step now is to paste the code in the needed code area (after the comma of base64, before the quote). I formatted my final code in Notepad++ to make it more readable and it looks like following now.

If your image is a PNG just replace the red marked part of your code to be PNG instead of JPG.

Finally I have to save my JSON file and import it into every Power BI report file I wish to use my new Theme.

As you can see the background image is saved within the Theme with the correct settings. In my case I set the transparency to 50%.

Please let me know if this post was helpful and give me some feedback. Also feel free to contact me if you have any questions.

If you’re interested in the files used in this blog check out my GitHub repo https://github.com/PBI-Guy/blog
Power BI Licensing

One of the most discussed topics with my customers and partners is Power BI licensing. Typical questions are

  • I want to create a report for my own use do I need a Power BI Pro license?
  • Does a report viewer also need a Power BI Pro license?
  • What if we have like 1000 Users does everybody need a Pro license?
  • What are the costs?

In this post I try to explain the different licensing options for Power BI. Further I’ll discuss some various scenarios and what kind of license would fit best.

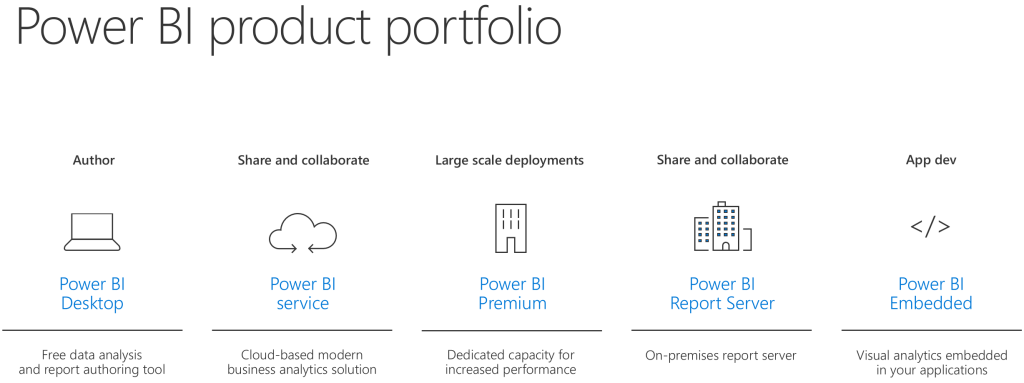
First things first. We need to understand what kind of products Power BI has in his portfolio.

Power BI Products

Power BI Desktop

The Power BI Desktop is a client application in which you can author modern and interactive reports. You can save those files as a PBIX format. I’ll highly recommend to install and use it as you have the full flexibility to create your report and data model, and modify it as needed. For more information please visit https://powerbi.microsoft.com/en-us/desktop

Power BI Service

The Power BI Service is a cloud-based modern business analytics solution in which you can publish (PBIX files) or even create reports. Creating reports in the service is – as of today – limited comparing it to Power BI Desktop. For example you can’t use DAX to enhance your model in the browser. You can find more information on https://docs.microsoft.com/en-us/power-bi/service-get-started

Power BI Premium

Power BI Premium is a dedicated capacity for your organization. It has the same functionality as the Power BI Service but it gives you more consistent performance, larger data volumes, and the flexibility you need. See also https://powerbi.microsoft.com/en-us/power-bi-premium

Power BI Report Server

Instead of going to the cloud Power BI offers a on-premises Report Server on which you can publish and distribute your Power BI reports in-house. It does not have all services & features like the Power BI Service – like the natural Q&A – but most of it. Further information can be found here https://powerbi.microsoft.com/en-us/report-server

Power BI Embedded

If you would like to embed Power BI Reports in your own application then Power BI Embedded is the right choice. It’s designed for Independent Software Vendors (ISVs) and developers. More information can be found here https://powerbi.microsoft.com/en-us/power-bi-embedded

Power BI Mobile

Power BI Mobile offers you to connect to your data and see your reports on the go for any device. You can download the app from Microsoft, on the App Store, or Google Play. For more information please visit https://powerbi.microsoft.com/en-us/mobile

After we have clarified what kind of products are available let’s deep-dive into the different licensing options.

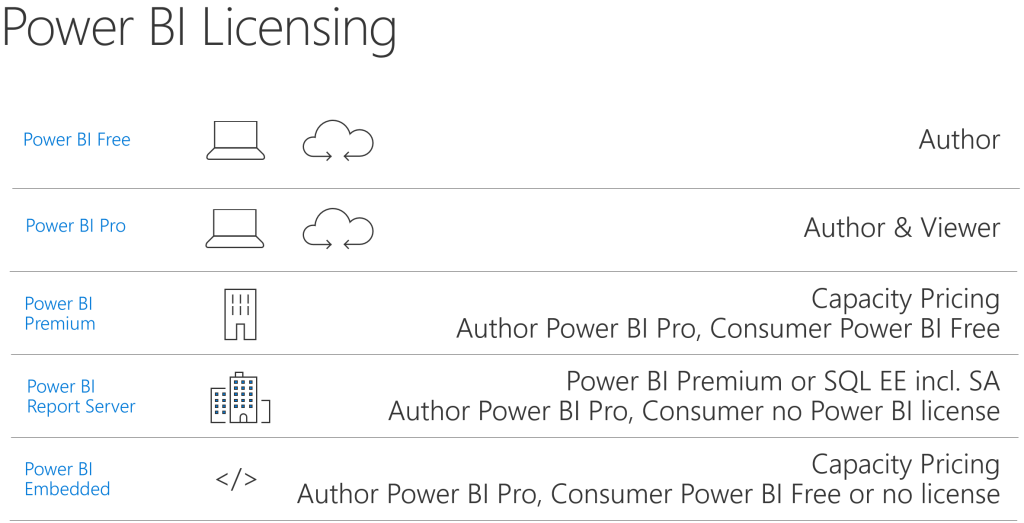
Power BI Licenses

Power BI Free

Power BI Desktop and Power BI Mobile are free for all users! Regardless of what other product (Power BI Service, Power BI Report Server, etc.) you are using those two are totally free. Further there is a limited Power BI Service free edition in which you can use following features: All Connectors, Publish to Web, and Export to PowerPoint, Excel, CSV. This means if I would like to create a report for myself I can download the Power BI Desktop, create a report, publish it to Power BI Service and use e.g. a Dashboard to combine different Reports. Further I can connect with my mobile device to Power BI Service and see my dashboard on the go. Awesome! The Power BI Free license is still required so an user can log in into the service. With the Power BI Free license Microsoft makes sure that the org admin has allowed access to Power BI Service in general for the specific user.

Power BI Pro

As mentioned Power BI Desktop and Power BI Mobile are free for all users but the Power BI Service free edition does not have all features covered. One of the most asked one is the “Peer-to-peer sharing” feature which allows me to share my Dashboards, Reports, and Datasets with other users. To be able to do so I, the author, have to have a Power BI Pro license regardless if my organization uses Power BI Service, Power BI Premium, Power BI Embedded, or Power BI Report Server. For the viewer of the report it depends what the company has decided to use. If Power BI Service is the chosen one then the viewer has to have a Power BI Pro License as well. If Power BI Premium or Power BI Report Server is in use than a consumer needs a Power BI Free License. Even if the License itself is free an administrator has to assign it to the user. For more information and a comparison between Free and Pro please visit https://docs.microsoft.com/en-us/power-bi/service-free-vs-pro

Power BI Premium

Power BI Premium is a capacity pricing variant. There are different sizes (cores) available. The Whitepaper can be downloaded here. Capacity pricing means that not all users need a License. Only the author has to have a Power BI Pro License. All viewers / consumers do not need a Pro License but the admin has still to assign a Free License to all needed users.

Power BI Premium per User

Power BI Premium Per User allows organizations to license Premium features on a per-user basis. Premium Per User (PPU) includes all Power BI Pro license capabilities, and also adds features such as paginated reports, AI, and other capabilities that are only available to Premium subscribers. More information can be found here: https://docs.microsoft.com/en-us/power-bi/admin/service-premium-per-user-faq

Power BI Report Server

An organization can purchase Power BI Report Server in two different ways: By using Power BI Premium you are also allowed to use Power BI Report Server or you have a SQL Server Enterprise Edition incl. Software Assurance. In both cases an author still needs a Power BI Pro License to share Power BI Reports. Viewers don’t need a license at all.

Power BI Embedded

With Power BI Embedded you are allowed to embed Power BI Reports into your own application. Depending on which License type (A, EM or P SKU) you are using viewers need a Power BI Free License assigned (EM or P SKU) or you have to manage authentication within your application (A SKU). In both cases an author still needs a Power BI Pro License to share reports. For more information please visit https://docs.microsoft.com/en-us/power-bi/developer/embedded-faq

Phu! That has been a lof of information! Let’s discuss now some various scenarios and see which Product would fit best and which License is needed.

Scenarios

Luke testing for himself

Let’s imagine Luke would like to build some Reports for himself. He would like to connect to different data sources like Excel, CSV, SQL Database and Google Analytics. Further he would like to build a Dashboard and connect to it with his tablet and mobile device.

In this case he will use Power BI Desktop to create and publish reports, Power BI Service to build Dashboards and Power BI Mobile to connect with his mobile device or tablet to his Dashboards. Everything is possible with the Power BI Free License.

Obi-Wan would like to see Luke’s Dashboard

Luke is so excited about Power BI and his Dashboard he would like to show it to Obi-Wan. Obi-Wan shouldn’t be able to change anything in the report therefore Luke wants to share it within the Power BI Service with him.

Luke and Obi-Wan will both use the Power BI Service and both need a Power BI Pro License to share and view the Dashboard.

Luke would like to leverage some Premium features and share it with Obi-Wan

Luke would like to enhance his report with some out-of-the-box AI capabilities that Power BI Premium offers. But just for the two of them it doesn’t make sense to purchase Power BI Premium. Therefore Luke decided to leverage the Power BI Premium per User license to get the Premium features like AI, paginated reports, and other capabilities.

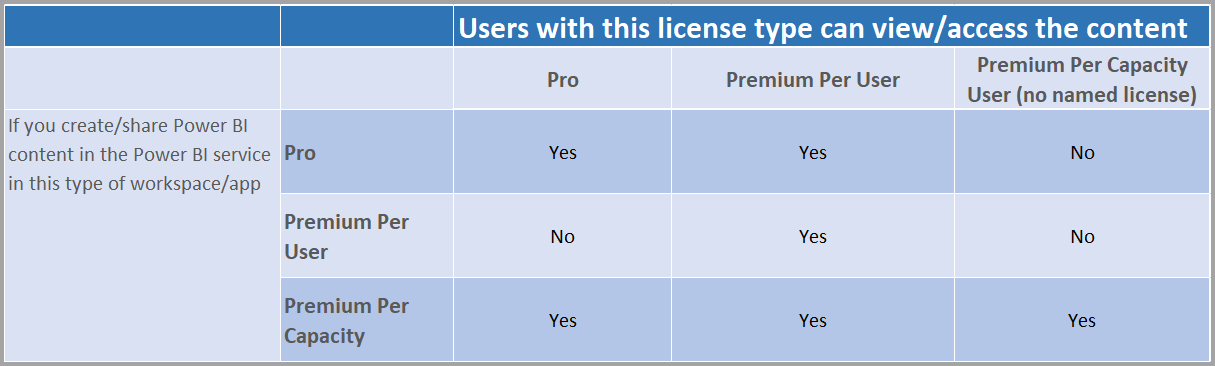
Because Luke would like to leverage Premium features he need a Power BI Premium per User (PPU) license. Because he wishes to share it with Obi-Wan, he also needs a PPU license due to the fact that Premium features are used and a Pro license is not sufficient. The matrix below will clarify which license type can view / access what kind of content.

Chart of which users can see content based on license types

The Rebels are interested in Luke’s Dashboard

Luke and Obi-Wan are both so excited about the possibilities of Power BI that they are telling everybody about it. Therefore the interest is growing and nearly every Rebel would like to see Luke’s Dashboard. Because of the growing interest, the huge number of viewers, and the more and more complex Dashboards Luke thinks a dedicated capacity would make sense.

In this scenario Luke would go for Power BI Premium. This means he has to republish his report from Power BI Desktop to the Premium capacity (or assign the existing workspace to a Premium node) and make it available for all Rebels incl. Obi-Wan. Because the Rebels are now using a Premium capacity non viewer needs a Power BI Pro License but Luke has still to assign a Free License to each user. Instead of doing it for each user separately he decides that every user can sign up individually for Power BI (Settings in Power BI admin portal). This reduces the burden for Luke.

The Senators pass a new galaxy data protection regulation (GDPR)

The Galactic Senators pass a new law which strictly forbid to use and show personal data without the approval of the person itself. Luke doesn’t want to take any risks and decides to go on-premises instead of the cloud until the Rebels clarify if they are allowed to use all personal data.

Luke installs a Power BI Report Server on which he publish his Report from Power BI Desktop. Further he added all users to the Report Server, shares his Report, and deletes the Dashboard, Report and Datasets in Power BI Service and Power BI Premium to make sure everything is by law. In this case Luke needs a Power BI Pro License to share his report while all other users as viewers need only a Power BI Free License. Further because they already purchased Power BI Premium the Rebels are allowed to use the Power BI Report Server as well.

R2D2 should show Power BI Dashboards

Luke would like to enable R2D2 to show his Dashboard. To do so he goes for Power BI Embedded.

Because Luke would like to show his Dashboard on his own application (or android 🙂 ) he needs to have Power BI Embedded. Further he doesn’t need any Power BI Service graphic user interface (GUI) therefore the A SKU is enough. But Luke still needs a Power BI Pro License to be able to share his Dashboard with others while all viewers do not need any License at all this time.

Now that we clarified what kind of products and Service Power BI offers as well as how to license them properly let’s have a look at the cost. I’ll use list prices publicly available from the Power BI website. Keep in mind that the prices can change.

Power BI License Cost

Power BI Desktop

As mentioned during the post Power BI Desktop is absolutely free and can be used without any cost.

Power BI Mobile

The Power BI App for your mobile device is also free.

Power BI Free License

The Power BI Free license is, as the name says, as well free and has no costs.

Power BI Pro License

The Power BI Pro License costs $9.99/User/Month. This means if you have for example five users and everyone will require a Pro license your monthly cost will be $49.95$ for the five users.

The Pro license can be purchased as stand alone or through E5 as Power BI Pro is included in E5.

Power BI Premium per User

The PPU License costs $20/User/Month. If you already have a Pro License you just need the add-on which is $10/User/Month. Imagine having seven users with a Pro License and ten users with a Free License and all of them require now a PPU. In this case you would need to purchase the add-on for seven users (7x$10) and ten PPU stand alone Licenses (10x$20) which means you’ll have a total cost of $339.93 (7x$9.99 Pro License + 7x$10 Add-on + 10x$20)

Power BI Premium

If you’re interested in Power BI Premium the smallest SKU (P1 with 8 v-cores) costs $4’995.- per month. From a purely cost perspective this makes sense if you have 500 or more users. This 500 users break-even-point can be easily calculated by dividing the Premium costs by the Pro License costs: 4995 / 9.99 = 500. Keep in mind that there are more reasons to go for Premium than just cost!

Imagine if you have to share a report with 600 users. In such a scenario every user would require a Pro License if you share it through Power BI Service. Therefore the total cost for these 600 users would be $5’994.- per month (600x$9.99). As we see it would make more sense to purchase Power BI Premium and assign a Pro License just to the developers of the report (let’s say 10 developers). In this case the total cost would be $5’094.90 (10x$9.99 + $4’995) and we saved roughly $900 per month!

Power BI Report Server

Power BI Report Server is included in Power BI Premium or through SQL Server Enterprise Edition with SA. In the first case, included in Premium, the minimal cost is therefore $4’995.- per month (P1 SKU with 8 v-cores). Just to point out that if you purchase Power BI Premium P1 you can use Premium and install a Power BI Report Server on top of it 8 cores in-house and use in total 16 cores!

If you’re interested in SQL Server Enterprise Edition with SA best would be to contact your Microsoft representative.

Power BI Embedded

Power BI Embedded is a Microsoft Azure Service and will charge you as long as it runs. Once you stop the Service there are no costs at all. The smallest SKU A1 is roughly $740 per month if it runs 24/7. A detailed price list can be found at https://azure.microsoft.com/en-us/pricing/details/power-bi-embedded/

Conclusion

I think the most important information is regardless of which product you are using (Power BI Service, Premium, Report Server or Embedded) as soon as you would like to share a Report you will need a Power BI Pro License. For the viewer it depends on which product the report is published. In Power BI Service a viewer also needs a Power BI Pro License, in Premium and Report Server a Free License is enough. For an embedded scenario a Free (A SKU) or non License (EM or P SKU) is required. Lastly, if Power BI Premium per User license is used by the author all viewers will also require the PPU license.

To get a better overview of the estimated cost I created a Power BI Report which you can use to calculate your cost based on the number of Power BI Developers and Viewers. Keep in mind Power BI Premium offers more features and could be useful not only to save cost! Check it out here.

Please let me know if this post was helpful and give me some feedback. Also feel free to contact me if you have any questions.

If you’re interested in the files used in this blog check out my GitHub repo https://github.com/PBI-Guy/blog
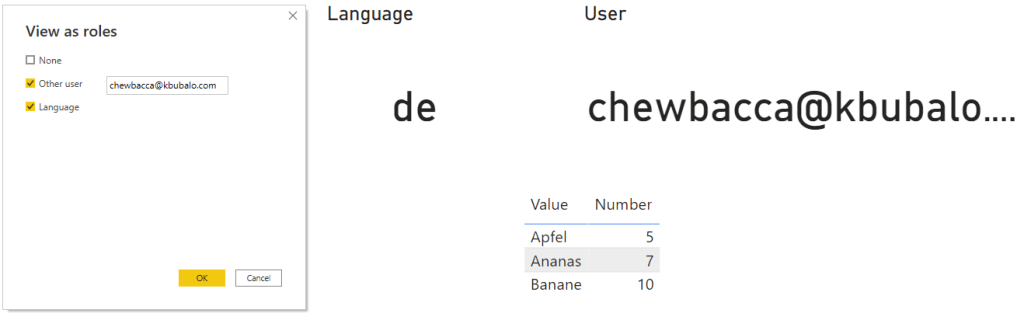
Power BI RLS configuration in Service

In my last two posts (see here and here) I wrote about Row-Level-Security (RLS) and how to configure it in Power BI Desktop. This time I would like to show how easy it is to publish a report to the Power BI Service and use the defined roles for specific users or security groups.

In this post I am going to use my last Power BI file with the RLS organizational hierarchy. As you guessed it right I am a big Star Wars fan and will use those characters for my demo. The picture below shows the current hierarchy.

Of course this hierarchy is not representative for the characters strenghts, popularity or similar. 🙂

The Power BI Report itself didn’t change a lot. Let’s imagine Obi-Wan is the author and creates a report with a table including all employees (Name and ID) and their salary, a card with the salary information and the current user ID. By pressing the Publish button in the Home Ribbon he can publish the report directly to his workspace in Power BI.

In this case Obi-Wan would like to publish it to the “PBI Guy” workspace. The publishing process will take a few seconds. Afterwards a success message will appear similar to the one below. With a click on the hyperlink the Power BI Report automatically opens in Power BI Services.

Once Power BI Services has loaded in Obi-Wan’s default browser he can extend the PBI Guy Workspace, hit the three dots of the Dataset and choose Security.

Now all in Power BI Desktop created roles are available and Obi-Wan can add users our groups to it. Because he created just one (Hierarchy) only one is available. Thanks to Azure Active Directory (AAD) suggestions are made while typing. For now he adds Luke and Yoda to the Hierarchy role. You can also add Security, Distribution, and Mail-enabled Groups. Once members are added they will be listed below.

Keep in mind that RLS works only for Viewers and users who has build permission on the dataset. Admin, Member, and Contributor of a workspace are not affected from RLS!

After saving one final step is required – test if RLS works as expected. To do so hit the three dots of her Hierarchy role and choose Test as role.

Choose the little arrow at the top and select on which behalf you would like to test the report. In my case I choose Luke and hit Apply afterwards. I do not select the Hierarchy role as it would test it than on my current logged in user.

As we can see RLS works perfectly fine!

One last test as Yoda confirms that RLS is working.

Now I can share the report with all users and only those who has the right permission will see what they are allowed to see – fantastic!

Please let me know if this post was helpful and give me some feedback. Also feel free to contact me if you have any questions.

If you’re interested in the PBIX and Excel file used in this blog post check out my GitHub repo https://github.com/PBI-Guy/blog

Power BI Row-Level-Security Organizational Hierarchy

In my first blog I showed how easy it is to set up RLS in general. This works perfectly fine if you’re working with a flat hierarchy. but what if it’s not flat? How to handle it? This post will show you how!

A common scenario is that a manager would like to see his and of his employees’ specific data like salary but of course the employees itself are only allowed to see their salary or from their employees below them in the org chart.

In my fictional organization Yoda is the top manager. Obi-Wan and Leia are on level 2 and each of them has two more employees (level 3). Yoda should be able to see his salary and every other as well. On the other side Obi-Wan has only the permission to see his and his employees’ salaries (Darth Vader and Luke Skywalker). Same goes for Leia. All level 3 employees mustn’t see level 1, 2, or from other people on their level. Therefore they are only allowed to see their own salary.

I created an example in Excel in which we have two tables. One (Table name Salary) with Employee ID, Manager ID and Salary. The other one (Table name Manager) with Employee ID, Employee Name and AD Account.

Now I open Power BI and connect to my Excel sheet. Once my table is loaded I check the relationship if the two tables “Salary” and “Manager” are correctly joined. Looks good so far.

Hint: If Power BI do not create a relationship automatically just create a new one by selecting Employee ID and drag and drop to the other field Employee ID.

My next step is to show the employees ID, employees name, salary, Manager ID and AD Account in a table to keep track if my data are shown correctly. Make sure employee ID and manager ID is not summarized.

My next step is to create a new column and add a so-called PATH function in my salary table. This function allows me to see the whole hierarchy path of each employee. I rename the column to “Hierarchy Path” and add the PATH function as follows: PATH(Salary[Employee ID], Salary[Manager ID]). As a result I get the whole hierarchy path for each employee separated by |.

My next step is to identify which user is logged in right now. To do so I add a new Measure in my Manager table and use the USERPRINCIPALNAME() function. My Measure is called User ID.

Because I do know now who is logged in I can match the AD Account and look which ID the user has. The function LOOKUPVALUE helps me to get the right information. Therefore I create another measure in my Salary table, call it Current User ID and use the following statement: LOOKUPVALUE(Salary[Employee ID], Manager[AD Account], [User ID]). To check if the correct user ID is taken I display my new measure in a table with the User ID. Yoda has the right Current User ID as we can see.

My final step is to add a new Role to manage the permission. I add a new one by selecting Manage Roles in the Modeling Ribbon, hit Create, rename it to Hierarchy and select the Salary table. At this point I add a new function called PATHCONTAINS which checks if something is inside a path – exactly what we are looking for because we have the whole hierarchy structure of each employee (function PATH) and we have also the current user ID (see LOOKUPVALUE). All we have to do now is to combine those bits of information like PATHCONTAINS([Hierarchy Path], [Current User ID]) = True.

My organizational hierarchy RLS is set up and should work! Let’s test is. As Yoda I should be able to see everything. I create a new table with Employee ID, Name and Salary. Afterwards I activate the Hierarchy role under View as Roles. Power BI notifies me that I’m viewing the Report in the role of Hierarchy. Nothing has changed so far because I can see everything as Yoda.

Now let’s change the user role. Right now I’m viewing my report as Yoda. Let’s try out Obi-Wan.

It works! Let’s test the last scenario with Darth Maul.

As we can see it works perfectly fine! With three simple functions I make sure that the permission is set up correctly and users can only see what they are allowed to see. Great!

In my next post I’ll show how to configure RLS properly in the Service.

Please let me know if this post was helpful and give me some feedback. Also feel free to contact me if you have any questions.

If you’re interested in the PBIX and Excel file used in this blog post check out my GitHub repo https://github.com/PBI-Guy/blog